This website is now archived. To find out what BERG did next, go to www.bergcloud.com.

Blog posts tagged as 'data'

Media Surfaces: The Journey

Following iPad light painting, we’ve made two films of alternative futures for media. These continue our collaboration with Dentsu London and Timo Arnall. We look at the near future, a universe next door in which media travels freely onto surfaces in everyday life. A world of media that speaks more often, and more quietly.

“The Journey” is the second ‘video sketch’ in the pair with ‘Incidental Media’ – this time looking at the panoply of screens and media surfaces in a train station, and the opportunities that could come from looking at them slightly differently.

The Journey

The other film can be seen here.

There’s no real new technology at play in any of these ideas, just different connections and flows of information being made in the background – quietly, gradually changing how screens, bits of print ephemera such as train tickets, and objects in the world can inter-relate to make someone’s journey that bit less stressful, that bit more delightful.

There’s a lot in there – so I wanted to unpack a few of the moments in the film in this (rather long!) blog post and examine them a bit.

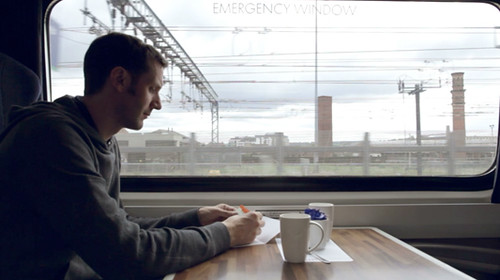
The film can be divided into two halves – our time in the station, and our time on the train.

The train journey itself is of course the thing at the centre of it all – and we’re examining how what we know about the journey – and the train itself, in some cases – can pervade the media surfaces involved in ways that are at once a little less ‘utilitarian’ and a little more, well, ‘useful’…

The first group of interventions could be characterised as the station wrapping around you, helping you get to your seat, on your train, for your journey, with the least stress.

Let’s start at the ticket machine.

Media Surfaces: The Journey: ticket vending

The screen supposes two things – that it knows where it is (it doesn’t move around much) and it knows where your train (in this case, “Arthur” – trains are people too!) is leaving from, and when. So why not do a simple bit of reassurance here? It’s twenty minutes to Arthur’s departure and it’s a 3 minute walk.

You’ve got 17 minutes to play with! Get a sandwich? A coffee? Or go and find your seat…

Before we do that I just want to point our something about the ticket machine itself…

Media Surfaces: The Journey: ticket machines that calm down the queue

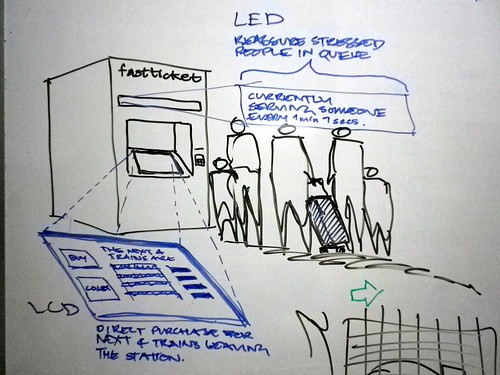
There’s the screen we’ve been interacting with to get our ticket, but there’s also a LED scroller above that.

As you can see in the concept sketch below, we’ve supposed that the scroller could give reassurance to the people in the queue behind you – maybe displaying the average turn-around-time of serving tickets to travellers, so if there is a queue, you’ll know how quickly it might move.

Media Surfaces: The Journey: Screens for the queue & you

I think when I was drawing this I had in mind the awesome-but-as-yet-unrealised scheme by Lisa Strausfeld and Pentagram NYC for a videowall in Penn Station.

I think I first saw this presented by Lisa Strausfeld at a conference some 8 or so years ago now, but it’s still wonderful. The large video wall has loads of different layers of information kind of interpolated and displayed all at once, at different ‘resolutions’.

So that if you’re approaching the station from down the street you read some overall information about the running of the station that day, and the time, and as you get closer you see news and stock prices, then closer again and you actually see the train times when you get close enough to crane your neck up at them.

Really clever, and a huge influence on us. The notion of several ‘reads’ of the information being presented on the same surface – if handled well, as in the Pentagram proposal – can be very powerful.

We’ve taken a much less high-tech approach, using the multitude of existing screens in the station, but staging the information they present intelligently in a similar way as you approach the platform and your train itself.

For instance, little messages on concourse screens about how busy the station is overall that morning…

Media Surfaces: The Journey: Stations that talk to you

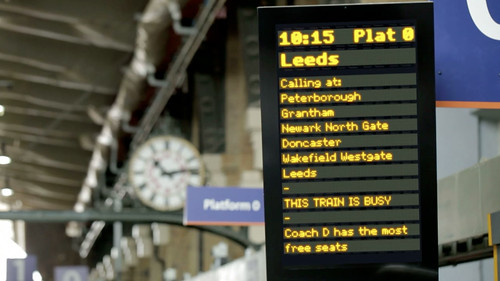
As we get to our platform we get the message that the train is going to pretty full but the station systems know where the bulk of reserved seats are, and can give us a little timely advice about where to hunt for a free place to sit…

Media Surfaces: The Journey: Platforms that talk to you

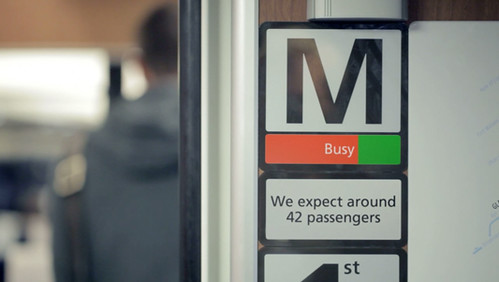
We’ve hinted in this image at a little bit of nice speculative quiet new technology that could be placed by the station workers: magnetically-backed e-ink signs – again displaying reassuring information about where the busy portions of the train will be.

Media Surfaces: The Journey: Expectation-Setting

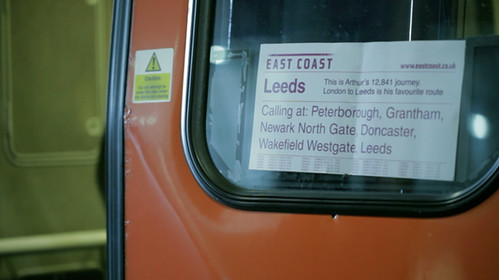
These little inventions have hopefully got you to your train (Arthur, remember?) on time, and in a more of a relaxed state of mind. So, as we board the train we might have time to note that this is Arthur’s favourite route…

Media Surfaces: The Journey: Arthur's favourite journey

If not, it doesn’t matter. It’s not a functional improvement to your journey but these touches lead to an appreciation of the service’s scale or reach and, if you are a regular traveller, inject a bit of recognition and delight into the otherwise routine.

Once onboard, we continue to explore opportunities for these incidental, different reads of information to both inform and delight.

In the first film ‘Incidental Media’, we introduce the concept of “Print can be quick” – looking at all the printed ephemera around us and how it can be treated as a media surface for more personalised, contextualised or rapidly-updated information.

After all, most of the printed matter associated with a train journey is truly print-on-demand: your tickets, your receipts and, as in this example, the printed reservation stub placed on the seat by the train attendants.

Media Surfaces: The Journey: Can I sit here?

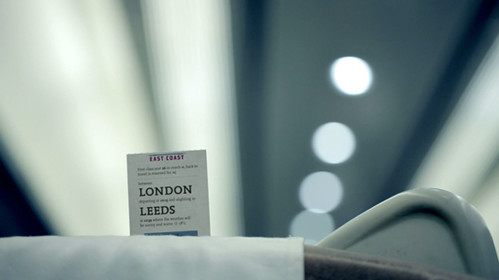
Here we wanted to look to the reassurances and reads that one takes of the reservation stubs as you move down the carriage – either with a reserved seat to find, or perhaps without a reservation on a busy train, opportunistically looking for an unoccupied seat that might be reserved for a latter portion of the train’s total journey.

In one of our concept sketches below we’re exploring that first case – could your ticket be the missing jigsaw piece to the reservation stub?

A bit Willy Wonka magic ticket!

Media Surfaces: The Journey: Reservations sketch

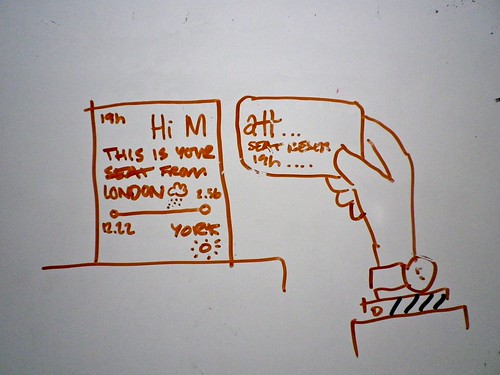
Privacy would be preserved by just using your first initial – printed large with salutations, attracting your eye easily to zero in on your seat as perhaps you struggle down the aisle with your baggage.

The final version used in the film takes this on board, but balances it a little more with the second use-case, that of the opportunistic search for a free seat by someone without a reservation. To answer that case, the portion of the journey that the seat is occupied for is clearly legible, whereas the initials of the traveller are only visible on scrutiny.

Media Surfaces: The Journey: Reservations sketch

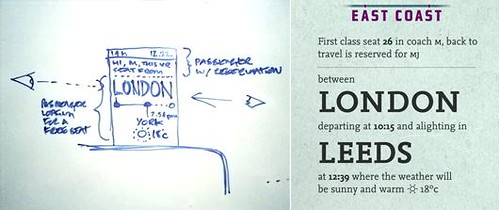
If it is indeed your reserved seat, on closer scrutiny you’ll also notice the weather forecast for your destination…

Again – worth noting brilliant past work in this area that’s an influence on this idea. Our friend Brian Suda’s redesign of an airline boarding pass that uses typographical hierarchy of the printed object to reassure and delight.

Here you can see that the time of your flight is clearly visible even if your boarding pass is on the floor.

Lovely stuff.

Finally, some pure whimsy!

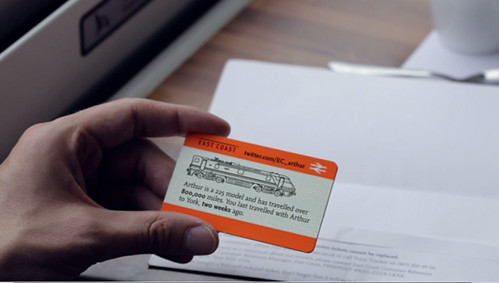
We wanted again to examine the idea that print can be nimble and quick and delightful – creating new forms of post-digital ephemera for collecting or talking about.

First of all, using the ticket to introduce you again to Arthur, your train, and perhaps extending that to recognising the last time you travelled together.

Media Surfaces: The Journey: Train factoids

But let’s go further.

We know that we’re going to be passing certain places at certain times, to some accuracy, during our journey.

The burgeoning amount of geo-located data about our environment means we could look to provide snippets from Wikipedia perhaps, with timings based on how they intersect with your predicted journey time – alerting you to interesting sights just as they pass by your window.

Media Surfaces: The Journey: paper-based AR

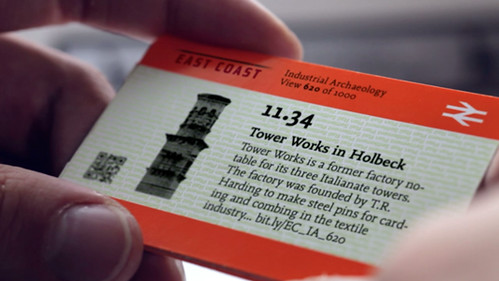
These tiny, personalised, collectable paper-spimes provide a kind of papernet augmented-reality – giving a routine journey an extra layer of wonder and interest.

Media Surfaces: The Journey: paper-based AR

As with “Incidental Media”, we’ve tried in “The Journey” to illustrate ‘polite media’ tightly bound to and complimenting one’s context. Media that lives and thrives usefully in the interstices and intervals of everyday routine and technology – indeed ‘making future magic’ instead of the attention arms race that the near-future of urban screens and media could potentially devolve into.

The Journey is brought to you by Dentsu London and BERG. Beeker has written about the films here.

Thank you to Beeker Northam (Dentsu London), and Timo Arnall, Campbell Orme, Matt Brown, and Jack Schulze!

Links from around the studio: paper computing, computer vision, simple and small

Matt J was busy running Papercamp last Saturday. One of my favourite things to emerge from the day was Basil Safwat’s Processing.A4. It’s computational cardboard; you follow the instructions on it to replicate the output of the Substrate Processing script.

Troika have launched their new artwork, Shoal, in Toronto.

Spanning across a 50 meter long corridor, 467 fish-like objects wrapped in iridescent colours and suspended from the ceiling rotate rhythmically around their own axis to display the movements and interdependency typical to school of fish.

Beautiful, though.

Niklas Roy’s My Little Piece of Privacy is a delightful computer-vision project:

My workshop is located in an old storefront with a big window facing towards the street. In an attempt to create more privacy inside, I’ve decided to install a small but smart curtain in that window. The curtain is smaller than the window, but an additional surveillance camera and an old laptop provide it with intelligence: The computer sees the pedestrians and locates them. With a motor attached, it positions the curtain exactly where the pedestrians are.

I really enjoyed his video of it – first, the project displayed-as-is, and then a detailed explanation of what the computer’s “seeing”. Through both parts, the hilarity of the little, jerkily moving curtain is not lost.

I’ve been enjoying dataists – a new blog about the science and interprtation of data – a great deal recently. Today’s post about What Data Visualisation Should Do is particularly good:

…yesterday I focused on three key things – I think – data visualization should do:
1. Make complex things simple
2. Extract small information from large data
3. Present truth, do not deceive

The emphasis is added to highlight the goal of all data visualization; to present an audience with simple small truth about whatever the data are measuring.

That felt like a nice addition to some of the topics covered in Matt J’s talk at citycamp and my own talk on data from a few weeks ago – but do read the whole post; it’s an insightful piece of writing.

Finally, some stop-motion animation. Our friends Timo Arnall and Matt Cottam recently linked to the videos some of their students at the Umeå Institue of Design produced during their week working on stop-motion techniques. They’re all charming; it’s hard to single any of them out – they’re all lovely – but the dancing radio (above) was a particular favourite.

Open Data for the Arts – Human Scale Data and Synecdoche

This is a short talk that I gave as part of a 45-minute workshop with Matthew Somerville at The Media Festival Arts 2010. As part of a session on how arts and cultural bodies can use open data, I talked about what I felt open data was, and what the more interesting opportunities it affords to are.

What is open data?

I’d describe “open data” as: “Making your information freely available for reuse in practical formats with no licensing requirements.

It’s not just sticking some data on a website; it’s providing it in some kind of data-format (be it CSV, XML, JSON, RDF, either via files or an API) for the intended purpose of being re-used. The more practical the format, the better.

You can still own the copyright; you can still claim credit. That doesn’t stop the data being open. But open data shouldn’t require payment.

More importantly:

What isn’t open data?

It’s not just sticking up web pages and saying it’s open because you won’t tell me off for scraping it.

It’s not any specific format. One particular crowd will tell you that open data has to be RDF, for instance. That is one format it can be, but it doesn’t have to be.

The success of your open data platform depends on how useful people will find it.

How do I know if it’s useful?

A good rule of thumb for “good open data” – and, by “good”, I mean “easy for people to use”, is something I’ve seen referred to as “The P Test“, which can be paraphrased as:

“You can do something interesting with it – however simple – in an hour, in a language beginning with P.”

Making something super-simple in an hour in Perl/PHP/Python (or similar, simple scripting language, that doesn’t begin with P, like Ruby or Javascript) is a good first goal for an open data set. If a developer can’t do something simple in that little time, why would they spend longer really getting to grips with your information? This, for me, is a problem with RDF: it’s very representative of information, as a data format, but really, it’s bloody hard to use. If I can’t do something trivial in an hour, I’m probably going to give up.

What are the benefits of open data?

The big benefit of open data is that it gets your “stuff” in more places. Your brand isn’t a logo, and it isn’t a building; it’s this strange hybrid of all manner of things, and your information is part of that. That information might be a collection, or a catalogue, or a programme. Getting that information in more places helps spread your brand.

As well as building your profile, open data can also build collaboration and awareness. I can build something out of someone else’s information as a single developer messing around, sure – but I can also build products around it that stand alone, and yet build value.

schooloscope-od.jpg

For instance, Schooloscope. Schooloscope looks at data about UK schools and put it together to give you a bigger picture. A lot of reporting about schools focuses on academic performance. Schooloscope is more interested in a bigger picture, looking at pupil happiness and change over time. We built this site around DFE data, Edubase data, and Ofsted reports. We’re building a product in its own right on top of other people’s data, and if the product itself is meaningful, and worthwhile… then that’s good for both your product and the source data – not to mention that data’s originators.

But for me, the biggest thing about open data is: it helps grow the innovation culture in your organisation.

The number-one user of open data should be you. By which I mean: if your information is now more easily accessible via an API (for instance), it makes it easier to build new products on top of it. You don’t have to budget for building interfaces to your data, because you’ve done it already: you have a great big API. So the cost of innovation goes down.

(A short note on APIs: when you build an API, build good demos. When I can see what’s possible, that excites me, as a developer, to make more things. Nothing’s worse than a dry bucket of data with no examples.)

Similarly: the people who can innovate have now grown in number. If you’ve got information as CSV – say, your entire catalogue, or every production ever – then there’s nothing to stop somebody armed with Excel genuinely doing something useful. So, potentially, your editorial team, your marketing team, your curators can start exploring or using that information with no-one mediating, and that’s interesting. The culture begins to move to one where data is a given, rather than something you have to request from a technical team that might take ages.

And, of course, every new product that generates data needs to be continuing to make it open. Nothing’s worse than static open data – data that’s 12, 18 months old, and gets updated once a year as part of a “big effort” – rather than just adding a day to a project to make sure its information is available to the API.

What’s the benefit for everyone else?

This is just a short digression about something that really interests me. Because here’s the thing: when somebody says “open data”, and “developers using your information”, we tend to imagine things like this:

red-dot-fever.jpg

Schuyler Erle called the above kind of map “red dot fever”: taking geolocated data and just putting it all on a map, without any thought. This isn’t design, this isn’t a product, this is just a fact. And it’s about as detached from real people as, to be honest, the raw CSV file was.

So I think one thing that open-data allows people to do is make information human-scale. And by which I mean: make it relevant, make it comprehensible, move it from where the culture might be to where *I* am.

And that lets me build an ongoing relationship with something that might have been incomprehensible.

I should probably show you an example.

tower-bridge-od.jpg

This is a Twitter bot that I built. It tells you when Tower Bridge is opening and closing. I stole the data from their website.

Or rather: Tower Bridge itself tells you when it’s opening and closing. Things on Twitter talk in the first person, so it should be itself. It becomes another voice in my Twitter stream, not just some bot intruding like a foghorn.

It exposes a rhythm. I built it because I used to work near Tower Bridge – I saw it every day. I liked the bot most when I was out of London; I’d see it opening and closing and know that London was still going on, still continuing. It has a silly number of followers, but not many of them interact with it daily. And yet – when you do, it’s useful; some friends found it helpful for reminding them not to leave the office for a bit.

And: you learn just how many times it opens/closes, but not in a numeric way; in a visceral way of seeing it message you.

lowflyingrocks-od.jpg

This is Low Flying Rocks by my friend Tom Taylor. It’s a bot that scrapes NASA data about asteroids passing within 0.2AU AU of Earth (an AU being 0.2 of the distance from the Earth to the sun). That’s quite close! What you discover is a) there are lots of asteroids passing quite close, and b) we know that they’re there. You both learn about the universe, and a little bit about our capacity to understand it. And you learn it not in some big glut of information, but slowly, as a trickle.

It feels more relevant because it’s at my scale.

And that leads to my final point.

Synecdoche

I want to talk about synecdoche, because I think that’s what these kind of Twitter bots are.

Synecdoche’s a term from literature, best explained as “the part representing a whole“. That’s a terrible explanation. It’s better explained with some examples:

A hundred keels cut the ocean“; “keel” stands for “ship“. “The herd was a hundred head strong“; “head” stands for “cow“.

So: for me, Tower Bridge is synecdoche, for the Thames, for London, for the city, for home. Low Flying Rocks is synecdoche not only for the scale of the universe, all the activity in the solar system, the earth’s place in that – but also for NASA, for science, for discovery.

Synecdoche allows you to make big, terrifying data, human-scale.

I was thinking, to wrap this session up, about a piece of data I’d like if I was building a Twitter bot, and I decided that what I’d love would be: what the curtain at the Royal Opera House was doing.

curtain.jpg

It sounds boring at first: it’s going to go up and down a few times in a performance. That means once an evening, and perhaps the odd matinee.

But it’s also going to go up and down for tech rehearsals. And fire tests. And who knows what else. It’s probably going up and down quite a lot.

And, as that burbles its way into my chat stream, it tells me a story: you may only think there’s a production a day in the theatre, but really, the curtain never stops moving; the organisation never stop working, even when you’re not there. I didn’t learn that by reading it in a book; I learned it by feeling it, and not even by feeling all of it – just a tiny little bit. That talking robot told me a story. This isn’t about instrumenting things for the sake of it; it’s about instrumenting things to make them, in one particular way, more real.

Yes, from your end, it’s making APIs and CSV and adding extra functionality to existing projects that are probably under tight budgets. But it allows for the things you couldn’t have planned for.

Open Data allows other people to juxtapose and invent, and tell stories, and that’s exciting.

Links round-up: Foursquare visualisation, cute projectorcams, AR videogames, task management

skitched-20100824-105917.jpg

Matt J provided this image of Kodak’s first digital camera, from 1975, and the accompanying story:

It was a camera that didn’t use any film to capture still images – a camera that would capture images using a CCD imager and digitize the captured scene and store the digital info on a standard cassette. It took 23 seconds to record the digitized image to the cassette. The image was viewed by removing the cassette from the camera and placing it in a custom playback device. This playback device incorporated a cassette reader and a specially built frame store. This custom frame store received the data from the tape, interpolated the 100 captured lines to 400 lines, and generated a standard NTSC video signal, which was then sent to a television set.

social-london.jpg

Matt B sent us Anil Bawa-Cavia’s visualisations of Foursquare check-in data for London, Paris and New York. The striking maps (an excerpt of which is displayed above) start by displaying activity across a uniform grid:

In these maps, activity on the Foursquare network is aggregated onto a grid of ‘walkable’ cells (each one 400×400 meters in size) represented by dots. The size of each dot corresponds to the level of activity in that cell. By this process we can see social centers emerge in each city.

There’s more at the link above, and also in Anil’s explanation of the techniques used – where he also provides a dump of all the data.

fella-projectorcam.jpg

Matt W found this lovely design for a digital camera with built-in pico projector. Of course the two lenses are eyes. And everything else stems from there.

Nick pointed out that Epic Win is now on sale. It’s a playful to-do list that turns doing tasks into experience points for an avatar, much as Chore Wars before it. What sets it out for me is just how much value there is in making a functional piece of software – in this case, a to-do list – well-designed and beautiful. It’s fun to use, without getting in the way of the basic task of making lists, and I want to go back to it. It’s worth playing with just for the consistency of its visual design.

Finally, I really liked David Arenou’s “Immersive Rail Shooter”. In it, he takes the standard video-game lightgun game and adds the ability to use the environment for cover, by placing AR tags around a room for the console’s camera to detect. From his site about the project, it appears to be a very much working prototype (as opposed to proof-of-concept video).

What’s really fun for me is that although it uses markers and computer vision to detect the player’s location, the “augmenting” of reality is done not through a camera and a screen – but by changing of the room the player interacts with. All of a sudden, the chair in the real-world becomes cover in the game-world, and so you end up ducking and diving around the living room. No glasses, no holding a mobile phone in front of your face, but the boundary between the game and reality has very definitely been blurred.

Humanising data: introducing “Chernoff Schools” for Ashdown

“Hello Little Fella” is a group I started on Flickr a few years ago, spotting faces.

For a little while I had been taking pictures of objects, furniture, buildings and other things in my environment where I recognised, however abstract, a face.

I tagged them with what I thought the appropriate greeting – “hello little fella!”  – and soon it caught on with a few friends too.

Currently there are over 500 pictures from 129 people in there.

This is not an original thought – there are many other groups such as the far-more-successful “Faces In Places” – which has over 14000 pictures and almost 4000 members.

Why is it so popular?

Why do we love recognising faces everywhere?

In part, it’s due to a phenomenon called “Pareidolia”

“[a] psychological phenomenon involving a vague and random stimulus (often an image or sound) being perceived as significant. Common examples include seeing images of animals or faces in clouds, the man in the moon, and hearing hidden messages on records played in reverse.”

Researchers, using techniques such as magnetoencephalography (!) have discovered that a part of our brains – the Fusiform Face Area – makes sure anything that resembles a face hits us before anything else…

Here comes the science bit – from Early (M170) activation of face-specific cortex by face-like objects. by Hadjikhani, Kveraga, Naik, and Ahlfors:

“The tendency to perceive faces in random patterns exhibiting configural properties of faces is an example of pareidolia. Perception of ‘real’ faces has been associated with a cortical response signal arising at approximately 170 ms after stimulus onset, but what happens when nonface objects are perceived as faces? Using magnetoencephalography, we found that objects incidentally perceived as faces evoked an early (165 ms) activation in the ventral fusiform cortex, at a time and location similar to that evoked by faces, whereas common objects did not evoke such activation. An earlier peak at 130 ms was also seen for images of real faces only. Our findings suggest that face perception evoked by face-like objects is a relatively early process, and not a late reinterpretation cognitive phenomenon.”

So, all-in-all humans are very adept at seeing other human faces then – even if they are described in abstract, or not even human.

How might we harness this ability to help humanise the complex streams of data we encounter every day?

One visualisation technique that attempts to do just that is the “Chernoff Face”

Hermann Chernoff first published this technique in 1972 (the year I was born).

Matt’s Webb’s mentioned these before in his talk, ‘Scope’, and I think I first became aware of the technique when I was at Sapient around ten years ago. Poking into it at that time I found the investigations of Steve Champeon from 1995 or so into using a Java applet to create Chernoff faces.

There’s interesting criticism of the technique, but I’ve been waiting for the right project to try it on for about a decade now – and it looks like Ashdown just might be the one.

Ashdown is our codename for a suite of products and services around UK schools data. We’re trying to make them as beautiful and useful as possible for parents, teachers and anyone else who’s interested. There’s more on Ashdown here.

Over the last couple of weeks, the service design of the ‘alpha’ has started to take shape – and we’ve been joined by Matthew Irvine Brown who is art-directing and designing it.

In one of our brainstorms, where we were discussing ways to visualise a school’s performance – Webb blurted “Chernoff Schools!!!” – and we all looked at each other with a grin.

Chernoff Schools!!! Awesome.

Matt Brown immediately started producing some really lovely sketches based on the rough concept…

drawing_2009-11-16 0.jpeg

And imagining how an array of schools with different performance attributes might look like…

drawing_2009-11-16 1.jpeg

Whether they could appear in isometric 3D on maps or other contexts…

drawing_2009-11-20

And how they might be practically used in some kind of comparison table…

chernoff-schools-nearby_500w

Since then Tom and Matt Brown have been playing with the data set and some elementary processing code – to give the us the first interactive, data-driven sketches of Chernoff Schools.

It’s still early days – but I think that the Chernoff Schools are an important step in Ashdown finding its character and positioning – in the same way as the city-colours and ‘sparklogos’ we came up with early on in Dopplr’s life were.

It’s as much a logo, a mascot and an endearing, ownable emblem as it is a useful visualisation.

I can’t wait to see how the team develops it over the coming months.

Toiling in the data-mines: what data exploration feels like

Matt’s mentioned in the past few summaries of weeks that I’ve been working on ‘material exploration’ for a project called Ashdown. I wanted to expand a little on what material exploration looks like for code and what it feels like to me, because it feels like a strange and foreign territory at times. This is my second material exploration of data for BERG, the first being at the beginning of the Shownar project.

There are several aspects to this post. Partly, it’s about what material explorations look like when performed with data. Partly, it’s about the role of code as a tool to explore data. We don’t write about code much on the site, because we’re mainly interested in the products we produce and the invention involved in them, but it’s sometimes important to talk about processes and tools, and this, I feel, is one of those times. At the same time, as well as talking about technical matters, I wanted to talk a little about what the act of doing this work feels like.

Programmers very rarely talk about what their work feels like to do, and that’s a shame. Material explorations are something I’ve really only done since I’ve joined BERG, and both times have felt very similar – in that they were very, very different to writing production code for an understood product. They demand code to be used as a sculpting tool, rather than as an engineering material, and I wanted to explain the knock-on effects of that: not just in terms of what I do, and the kind of code that’s appropriate for that, but also in terms of how I feel as I work on these explorations. Even if the section on the code itself feels foreign, I hope that the explanation of what it feels like is understandable.

Material explorations

BERG has done material explorations before – they were a big part of our Nokia Personalisation project, for instance – and the value of them is fairly immediate when the materials involved are things you can touch.

But Ashdown is a software project for the web – its substrate is data. What’s the value of a material exploration with an immaterial substrate? What does it look like to perform such explorations? And isn’t a software project usually defined before you start work on it?

Not always. Invention comes from design, and until the data’s been exposed to designers in a way that they can explore it, and manipulate it, and come to an understanding of what design is made possible by the data, there essentially is no product. To invent a product, we need to design, and to design, we need to explore the material. It’s as simple as that.

There’s a lot of value in this process. We know, at a high level, what the project’s about: in the case of Ashdown, Matt’s described it as “a project to bring great user experience to UK education data“. The high level pitch for the project is clear, but we need to get our hands mucky with the data to answer some more significant questions about it: what will it do? What will it feel like to use? What are the details of that brief?

The goals of material exploration

There are several questions that the material exploration of data seeks to answer:

  • What’s available: what datasets are available? What information is inside them? How easily are they to get hold of – are they available in formatted datasets or will they need scraping? Are they freely available or will they need licensing?
  • What’s significant: it’s all very well to have a big mass of data, but what’s actually significant within it? This might require datamining, or other statistical analysis, or getting an expert eye on it.
  • What’s interesting: what are the stories that are already leaping out of the data? If you can tell stories with the data, chances are you can build compelling experiences around it.
  • What’s the scale: getting a good handle on the order of magnitude helps you begin to understand the scope of the project, and the level of details that’s worth going into. Is the vast scale of information what’s important, or is it the ability to cherry-pick deep, vertical slices from it more useful? That answer varies from project to project.
  • What’s feasible: this goes hand in hand with understanding the scale; it’s useful to know how long basic tasks like parsing or importing data take to know the pace the application can move at, or what any blockers to a realistic application are. There is lots of scope to improve performance later, but knowing the limitations of processing the dataset early on helps inform design decisions.
  • Where are the anchor points: this ties into “what’s significant”, but essentially: what are the points you keep coming back to – the core concepts within the datasets, that will become primary objects not just in the code but in the project design?
  • What does it afford?: By which I mean: what are the obvious hooks to other datasets, or applications, or processes. Having location data affords geographical visualisation – maps – and also allows you to explore proximity; having details of Local Education Authorities allows you to explore local politics. What other ideas immediately leap into mind from exploring the data?

To explore all these ideas, we need to shape the data into something malleable: we need to apply a layer of code on the top of it. And it can’t just exist as code: we also need the beginnings of a website.

This won’t be the final site – or even the final code – but it’s the beginnings of a tool that can explain the data available, and help explore them, to designers, developers, and other project stakeholders, and that’s why it’s available, as early as possible, as an actual site.

To do this, the choice of tools used is somewhat important, but perhaps more important is the approach: keeping the code malleable, ensuring no decisions are too binding, and not editorialising. “Show everything” has become a kind of motto for this kind of work: because no-one else knows the dataset yet, it’s never worth deeming things “not worth sharing” yet. Everything gets a representation on the site, and then informed design decisions can be made by the rest of the team.

What does the code for such explorations look like?

It’s a bit basic. Not simple, but we’re not going to do anything clever: architecture is not the goal here. It will likely inform the final architecture, and might even end up being re-used, but the real goal is to get answers out of the system as fast as possible, and explore the scale of the data as widely as possible.

That means doing things like building temporary tables or throwaway models where necessary: speed is more important than normalisation, and, after all, how are you going to know how to structure the data until you’ve explored it?

Also, because we’re working on very large chunks of data, it’s important that any long running processes – scrapers, parsers, processors – need to be really granular, and able to pick up where they left off; my processing tasks usually only do one thing, and require running in order, but it’s better than one long complex process that can’t be restarted – if that falls over in the middle and can’t be restarted, it’s a lot of time (a valuable resource at these early stages) wasted.

It’s also important that there’s a suitably malleable interface to the data for you, the developer. For me, that’s a REPL/console of some sort – something slightly higher level than a MySQL terminal, that lets you explore codified representations of data (models) rather than just raw information. Shownar was built in PHP, and whilst it was, for many reasons, the right choice of platform for the project, I missed having a decent shell interface onto the system. On Ashdown, I’m working in Rails, and already the interactive console has made itself indispensable. For a good illustration of the succinct power of REPLs, and why they’re a useful thing to have around for data exploration, it’s definitely worth reading Simon Willison’s recent post on why he likes Redis.

Visualisation

Visualisation is a really important part of the material exploration process. When it comes to presenting our explorations, it’s not just enough to have big lists, and vast, RESTful interfaces on top of blobs of data: that’s still not a very effective translation of the stories the data tells. Right now, we don’t need to be fussy about what we visualise: it’s worth sticking graphs everywhere and anywhere we can, just to start exploring new representations of the data. It’s also useful to start learning what sort of visual representations suit the data: some data just doesn’t make as much sense in a graph as a table, and that’s OK – but it’s good to find out now.

Because now isn’t the time to be shaving too many yaks, when it comes to visualisation libraries and tools, the ones that are fastest or that you are most familiar with are probably the best. For that reason, I like libraries that only touch the client-side such as the Google Charts API, or gRaphael (which I’ve been using to good effect recently). Interactive graphs, of the kind gRaphael makes trivial, are more than just eye candy: it’s actually really useful, with large datasets, to be able to mouse around a pie chart and find out which slice corresponds to which value.

Visualisation isn’t just a useful lens on the data for designers; it can be hugely beneficial for developers. A recent example of the usefulness of visualisation for development work in progress comes from this video behind the scenes on Naughty Dog’s PS3 game Uncharted 2: Among Thieves. About twenty seconds in, you can see this image:

of a developer playing the game with a vast amount of telemetry overlaid, reacting as he plays. It’s not pretty, but it does provide an immediate explanation of how gameplay affects the processors of the console, and is clearly an invaluable debugging tool.

What data exploration feels like

It often feels somewhat pressured: time is tight and whilst an hour spend going down the wrong alley is fine, a day spent fruitlessly is somewhat less practical. At the same time, without doing this exploration, you won’t even know what is “fruitless”. It can be frightening to feel so directionless, and overcoming that fear – trusting that any new information is the goal – is tough, but important to making progress.

It can also be overwhelming. Shownar ended up with a massive dataset; Ashdown’s is huge already. That dataset – its meaning, its structure – gets stuck in your head, and it’s easy to lose yourself to it. That often makes it harder to explain to others – you start talking in a different langauge – so it becomes critical to get it out of your head and onto screens.

It also feels lonely in the data-mines at times. Not because you’re the only person working on it, but because no-one else can speak the language you do; the deeper you get into the data, the harder you have to work to communicate it, and the quicker you forget how little anyone else on the project knows.

Invention becomes difficult: being bogged down in the mechanics of Making It Work often makes it hard for me to have creative ideas about what you can do with that data, or new ways of looking at it. Questions from others help – a few simple questions about the data opens enough avenues to keep me busy all day. One thing we tried to do was ensure that I made a “new graph” every day; the graph should only take about 30 minutes to write the code and do, but it ensures that I don’t spend all my time on writing processing or scraping code.

At times, the code you’re writing can feel a bit string and glue – not the robust, Quality Code you’d like to be writing as a developer. I’d like to TATFT, but this isn’t the place for it: we’re sculpting and carving at the moment, and the time for engineering is later. For now, getting it on the screen is key, and sometimes, that means sacrifices. You learn to live with it – but just make sure you write the tests for the final product.

There are a lot of pregnant pauses. For Ashdown, I’ve had long-running processes running overnight on Amazon EC2 servers. Until I come in the next day, I have no idea if it worked, and even if it did work, whether or not it’ll be useful. As such, the work is bursty – there’s code, and a pause to gather results, and then a flurry of code, and then more gathering. All I’ve learned to date is: that’s the rhythm of exploration, and you learn to deal with it.

What emerges at the end of this work?

For starters, a better understanding of the data available: what there is, how to represent it, what the core concepts are. Sometimes, core concepts are immediately obvious – it’s likely that “schools” are going to be a key object in Ashdown. Sometimes, they’re compound; the core concept in Shownar turned out to be “shows”, but how the notion of a ‘show’ was represented in the data turned out to be somewhat complex. As part of these core concepts, the beginnings of a vocabulary for the application emerge.

Technically, you’ve got the beginnings of a codebase and a schema, but much of that might be redundant or thrown out in future; you shouldn’t bet on this, but it’s a nice side effect. You also might, as a side effect of building a site, have the beginnings of some IA, but again, don’t bet on it: that’s something for designers to work on.

You should also have a useful tool for explaining the project to colleagues, stakeholders, and anyone coming onto the project new – and that tool will allow everyone else to gain insight into just what’s possible with the data available. Enabling creativity, providing a tool for non-developers to explore the data, is the key goal of such exploration. And that leads into a direction and brief for the final piece of software – and it’s a brief that you can be confident in, because it’s derived from exploration of the data, rather than speculation.

And then, the invention can begin.

The Pillar Of Autumn

Autumn arrived abruptly in our studios last week, and we weren’t the only people feeling it.

Our friends upstairs at Pachube are wiring up the world for real-time sensor-data sharing, and so were able to see the sudden addition of electric heaters in the building through the spike in the graph below…

Recent Posts

Popular Tags