This website is now archived. To find out what BERG did next, go to www.bergcloud.com.

Blog posts tagged as 'ashdown'

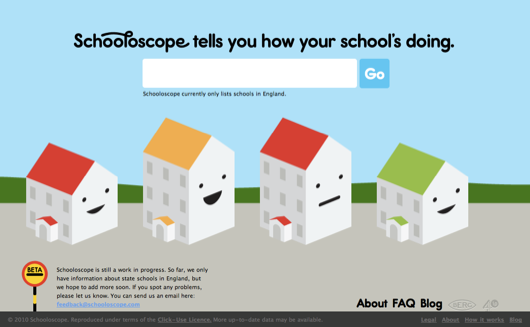
Say hello to Schooloscope

Schooloscope is a new project from BERG, and I want to show it to you.

What if a school could speak to you, and tell you how it’s doing? “I have happy kids,” it might say. “Their exams results are great.”

Schools in England are inspected by a body called Ofsted. Their reports are detailed and fair — Ofsted is not run by the government of the day, but directly by Parliament. And kids in schools are tracked by the government department DCSF. They publish everything from exam results to statistical measurements of improvement over the school careers of the pupils.

Cooooomplicated.

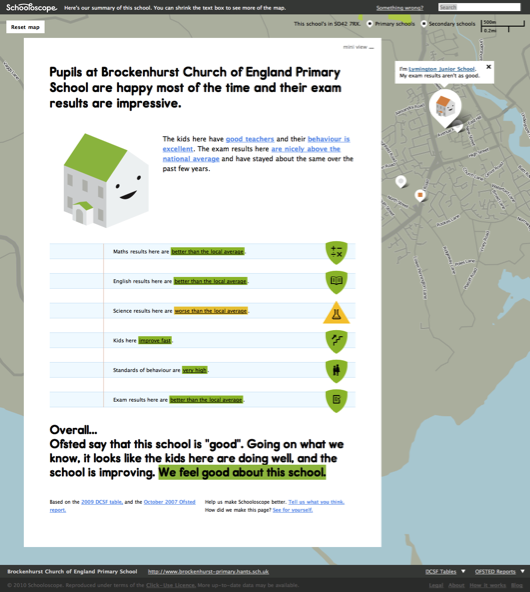
What Schooloscope does is tell you how your school’s doing at a glance.

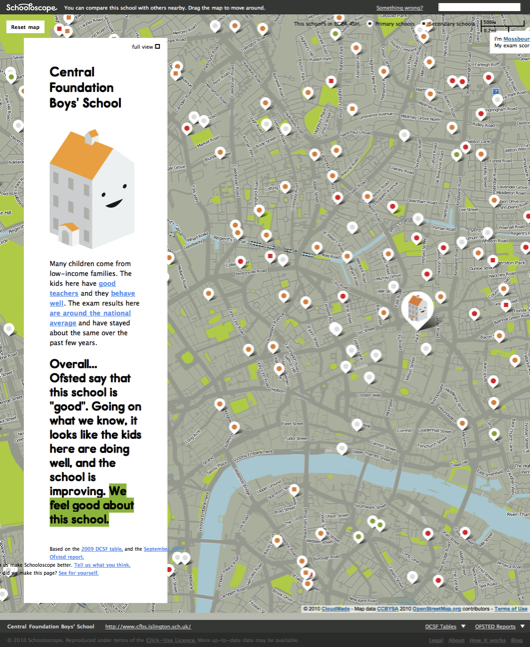
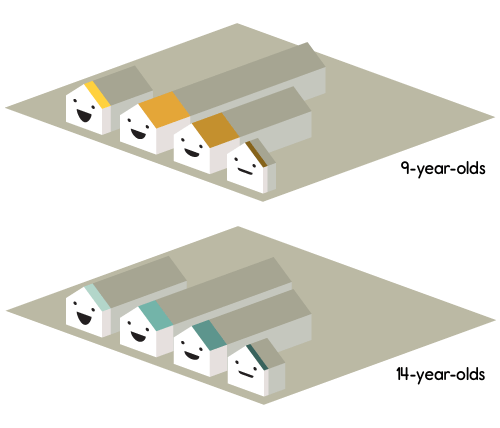
There are pictures of smiling schools. Or unhappy ones, if the kids there aren’t happy.

Each school summarises the statistics in straightforward, natural English. There are well over 20,000 state schools in England that we do this for. We got a computer to do the work. A journalism robot.

You can click through and read the actual stats afterwards, if you want.

Why?

A little of my personal politics. Education is important. And every school is a community of teachers, kids, parents, governors and government. The most important thing in a community is to take part on an equal footing and with positive feeling. Parents have to feel engaged with the education of their children.

As great as the government data is, it can be arcane. It looks like homework. It’s full of jargon… and worse, words that look like English but that are also jargon.

Schooloscope attempts to bring simplicity, familiarity, and meaning to government education data, for every parent in England.

A tall order!

This is a work in progress. There are lots of obvious missing features. Like: finding schools should be easier! There are bugs. There’s a whole bunch we want to do with the site, some serious and some silly. And full disclosure here: over the next 6 months we’re working on developing and commercialising this. Schooloscope is a BERG project funded by 4iP, the Channel 4 innovation fund. Is it possible to make money by being happily hopeful about very serious things and visualising information with smiling faces? I reckon so.

Anyway. The way we learn more is by taking Schooloscope public, seeing what happens, and making stuff.

The team! Tom Armitage and Matt Brown have worked super hard and made a beautiful thing which is only at the start of its journey. They, Matt Jones and Kari Stewart are taking it into the future. Also Giles Turnbull, Georgina Voss, and Ben Griffiths have their fingerprints all over this. Tom Loosemore and Dan Heaf at 4iP, thanks! And everyone else who has given feedback along the way.

Right, that’s launch out of the way! Let’s get on with the job of making better schools and a better Schooloscope.

Say hello to Schooloscope now.

Ashdown x 4iP

The suite of UK education products we’ve been designing and building, codenamed Ashdown, is also known as School Report Card.

I am extremely happy to say, today, that Ashdown is funded by an investment from 4iP/Channel 4. Read 4iP’s reasons for investing, and what TechCrunch Europe find interesting.

For us, it’s the ideal project: Ashdown has to be beautiful, inventive and mass-market. There’s the humanising of big data, with big information design and technical challenges. And it’s about citizenship. Giving people tools to know and understand more, to have agency in the world and to work together – as parents, teachers, pupils and government – to improve schools and society. These are all goals and qualities we care about deeply.

It’s an important moment for us, too, an opportunity for BERG to put its product and design instincts on the line. And, strategically, Ashdown is in an good space for us, sitting neatly between client services and our self-funded new product development. It brings good balance to the studio.

We love working with the folks at 4iP, and we’re totally looking forward to seeing where this takes us. It’s been full of great challenges already.

Check out our posts about Ashdown so far for a taste of our approach. More in the coming months!

1 in 3 schools are what? A story of what statistics can tell us

In the UK, schools are inspected every few years to make sure they’re educating kids well and run effectively.

Ofsted, the agency that visits the schools and writes the inspection reports, yesterday released their 2008/09 Annual Report. It’s a 160 page beast of stats, strengths and weaknesses, everything schools and the government need to focus their congratulations and new efforts. There’s a short commentary at the beginning which is great, but on the whole it has quite a lot of technical language.

The Daily Mail covered the report with a shocking headline, How 1 in 3 schools fail to provide adequate teaching. Gosh.

We decided to have a basic poke at the numbers ourselves, since we’ve just started working on Ashdown and have them all handy. (Ashdown is our name for a suite of beautiful and useful products we’re making for parents and teachers around UK schools data.)

So let’s have a look.

It’s pupils that matter to parents, so let’s look at 9- and 14-year-olds.

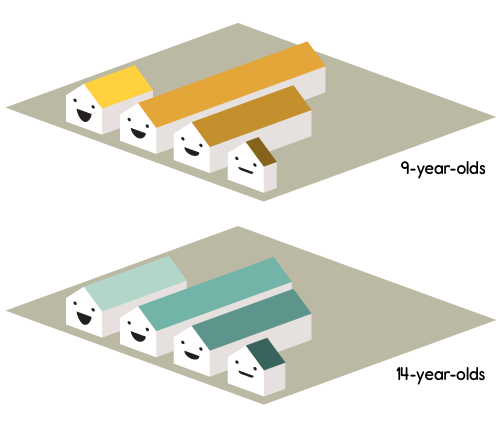
There are some 160,000 9-year-olds at schools in England that have been inspected in the last year (between September 2008 and August 2009). And about 161,000 14-year-olds, if you care about secondary schools. Let’s see how they break down…

9+14-year-olds at recently inspected schools in England

Pupils at schools recently graded by Ofsted in England

Happy schools are better schools.

A shade off two-thirds of all 9-year-olds and all 14-year-olds go to schools that are good or outstanding. But how about that Daily Mail headline? What does “not adequate” mean?

To find out about that I should say something about how Ofsted gives grades to schools. This is the terminology bit.

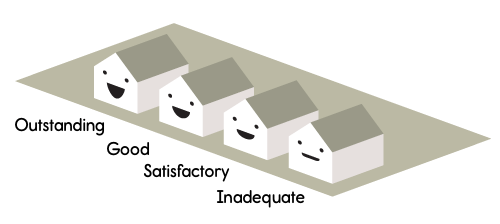
Oftsed grades

Ofsted do a few types of inspection, one of which is called a “Section 5 Inspection.” At the top of a report (here’s an example, taken totally at random) there’s a line called “Overall effectiveness of the school.” Right by it is a grade… 1 and 2 are outstanding and good respectively. There are also grades 3 and 4.

Grade 3 is “satisfactory.” You can read how Ofsted inspectors evaluate schools. It’s a bit dry, but in a nutshell a grade of ‘satisfactory’ means this: there’s nothing wrong with student performance, school leadership, value for money, or possibilities for improvement. Ofsted promise to inspect the school again within 3 years, and will make an interim visit just about half the time.

“Inadequate,” grade 4, means something is wrong with either how the kids are being educated, or the ability of the teachers to lead and improve the school. It’s pretty harsh.

1 in 3 schools are what?

Looking at our numbers, one in three pupils go to schools that are satisfactory or inadequate. Hang on, the headline said “fail to provide adequate teaching.” But only one in twenty pupils go to “inadequate” schools. Nineteen out of twenty go to schools that are satisfactory or better.

My confusion, I guess, arises because the headline uses a word which is very close to Ofcom’s own terminology – “inadequate” (grade 4) and “adequate” (in the headline, unused by Ofsted) – and so becomes ambiguous. That’s a shame. Is satisfactory adequate or not? I have no idea. How much do we care? The ambiguity obscures these discussions, but it’s great that journalism is provoking them. It’s huge, the difference in the numbers, between “satisfactory” being a grade we celebrate or one we don’t tolerate.

It’s also worth thinking about the purpose of these kind of statistics. What are stats for?

Let’s revisit Ofsted inspections. If you look again at a report (here’s another random example) and scroll riiight to the bottom, you’ll get a letter from the inspectors themselves written to the pupils of the school. In it the inspectors outline the strengths and weaknesses of the school, and what the school (and the pupils) need to do to improve. And that’s the whole point. It reinforces what’s good, and points out where effort is needed.

The Annual Report does a similar job. It’s a summary view to help focus the congratulations and efforts of parents, teachers and government bodies. Is it great or a concern that 19 out of 20 pupils go to schools that are satisfactory or better? Should we say only 19 out of 20?

In short: is “satisfactory” good enough? These numbers don’t tell us. That’s a matter for public debate.

A new kind of journalism

Holding that the job of statistics is to help target effort, we can go a little further.

We made another chart, for pupils at the “most deprived” schools, and how those schools are doing. Ofsted define the “most deprived” schools as the 20% of schools with the highest proportion of free school meals, so we did the same. (That means we’re looking at inspected schools in England that offer free school meals to 26% of their pupils or more.)

9+14-year-olds-02a

Pupils at “most deprived” schools recently graded by Ofsted in England

A couple of things to note here… the first is that we’re dealing with 37,000 9-year-olds and 23,000 14-year-olds. That’s a lot of kids. The second is that the general shape of the graph has changed. There are, proportionately, more inadequate schools.

And that’s an interesting story: if you’re a pupil aged 9 or 14, anywhere in England, we’ve seen you have about 1 in 20 chance of being at inadequate school. But if you go to one of the most deprived schools, that’s more like 1 in 13.

Now that sucks. Should we really allow there to be more inadequate schools in the most deprived areas? Shouldn’t those schools, in fact, be so well funded that they’re better than schools in general? Well, that priorities decision is a matter for our democratic system, and these are the kind of numbers journalism can provide to inform that debate.

Reports and reporting

What Ofsted’s Annual Report shows is that most pupils – a very large majority – go to schools that are satisfactory, good, or outstanding. But that pupils who go to the most deprived schools aren’t quite as lucky. I still don’t know what the difference is really like, on the ground, between a “satisfactory” and a “good” school, but I’ll reveal my personal politics: I’m glad I now have an opinion where the government should be targeting my tax money, and, from the inspection evaluation notes, I think that the report shows that generally schools are doing a great job.

There are a hundred stories like this in the data. It’ll take a bunch of hard graft and some clever maths to find the really surprising stories (that’s part of what we’re up to). But it’s all there. Actually it’s mostly all there in Ofsted Annual Report too, but percentages are hard to read and so another big part of Ashdown’s job is to add friendly meaning and understanding. That is, to point out which of these hundreds of numbers are important, from the perspective of pupils, parents and teachers.

Thanks Tom for a whole load of number crunching very early in the project, and thanks Matt Brown for whipping up these graphs!

Now back to your regularly scheduled programming…

Humanising data: introducing “Chernoff Schools” for Ashdown

“Hello Little Fella” is a group I started on Flickr a few years ago, spotting faces.

For a little while I had been taking pictures of objects, furniture, buildings and other things in my environment where I recognised, however abstract, a face.

I tagged them with what I thought the appropriate greeting – “hello little fella!”  – and soon it caught on with a few friends too.

Currently there are over 500 pictures from 129 people in there.

This is not an original thought – there are many other groups such as the far-more-successful “Faces In Places” – which has over 14000 pictures and almost 4000 members.

Why is it so popular?

Why do we love recognising faces everywhere?

In part, it’s due to a phenomenon called “Pareidolia”

“[a] psychological phenomenon involving a vague and random stimulus (often an image or sound) being perceived as significant. Common examples include seeing images of animals or faces in clouds, the man in the moon, and hearing hidden messages on records played in reverse.”

Researchers, using techniques such as magnetoencephalography (!) have discovered that a part of our brains – the Fusiform Face Area – makes sure anything that resembles a face hits us before anything else…

Here comes the science bit – from Early (M170) activation of face-specific cortex by face-like objects. by Hadjikhani, Kveraga, Naik, and Ahlfors:

“The tendency to perceive faces in random patterns exhibiting configural properties of faces is an example of pareidolia. Perception of ‘real’ faces has been associated with a cortical response signal arising at approximately 170 ms after stimulus onset, but what happens when nonface objects are perceived as faces? Using magnetoencephalography, we found that objects incidentally perceived as faces evoked an early (165 ms) activation in the ventral fusiform cortex, at a time and location similar to that evoked by faces, whereas common objects did not evoke such activation. An earlier peak at 130 ms was also seen for images of real faces only. Our findings suggest that face perception evoked by face-like objects is a relatively early process, and not a late reinterpretation cognitive phenomenon.”

So, all-in-all humans are very adept at seeing other human faces then – even if they are described in abstract, or not even human.

How might we harness this ability to help humanise the complex streams of data we encounter every day?

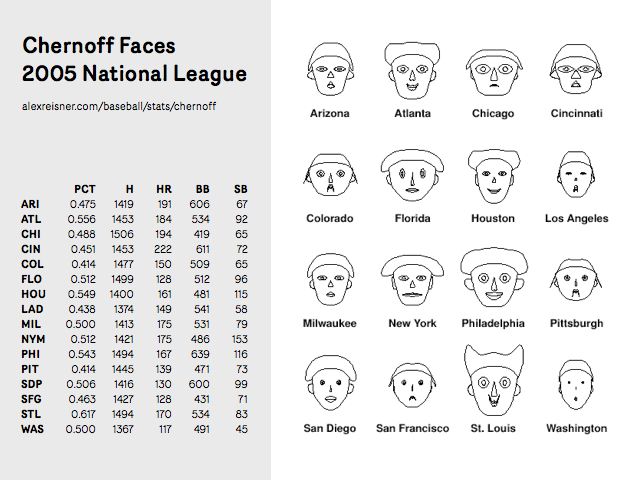
One visualisation technique that attempts to do just that is the “Chernoff Face”

Hermann Chernoff first published this technique in 1972 (the year I was born).

Matt’s Webb’s mentioned these before in his talk, ‘Scope’, and I think I first became aware of the technique when I was at Sapient around ten years ago. Poking into it at that time I found the investigations of Steve Champeon from 1995 or so into using a Java applet to create Chernoff faces.

There’s interesting criticism of the technique, but I’ve been waiting for the right project to try it on for about a decade now – and it looks like Ashdown just might be the one.

Ashdown is our codename for a suite of products and services around UK schools data. We’re trying to make them as beautiful and useful as possible for parents, teachers and anyone else who’s interested. There’s more on Ashdown here.

Over the last couple of weeks, the service design of the ‘alpha’ has started to take shape – and we’ve been joined by Matthew Irvine Brown who is art-directing and designing it.

In one of our brainstorms, where we were discussing ways to visualise a school’s performance – Webb blurted “Chernoff Schools!!!” – and we all looked at each other with a grin.

Chernoff Schools!!! Awesome.

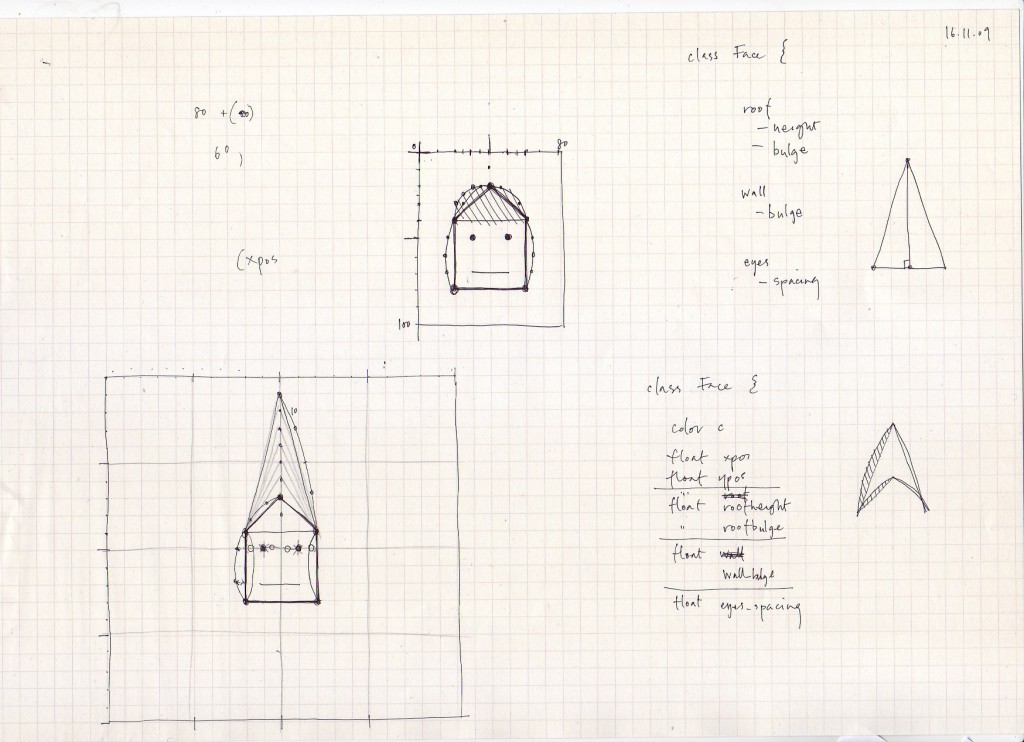
Matt Brown immediately started producing some really lovely sketches based on the rough concept…

drawing_2009-11-16 0.jpeg

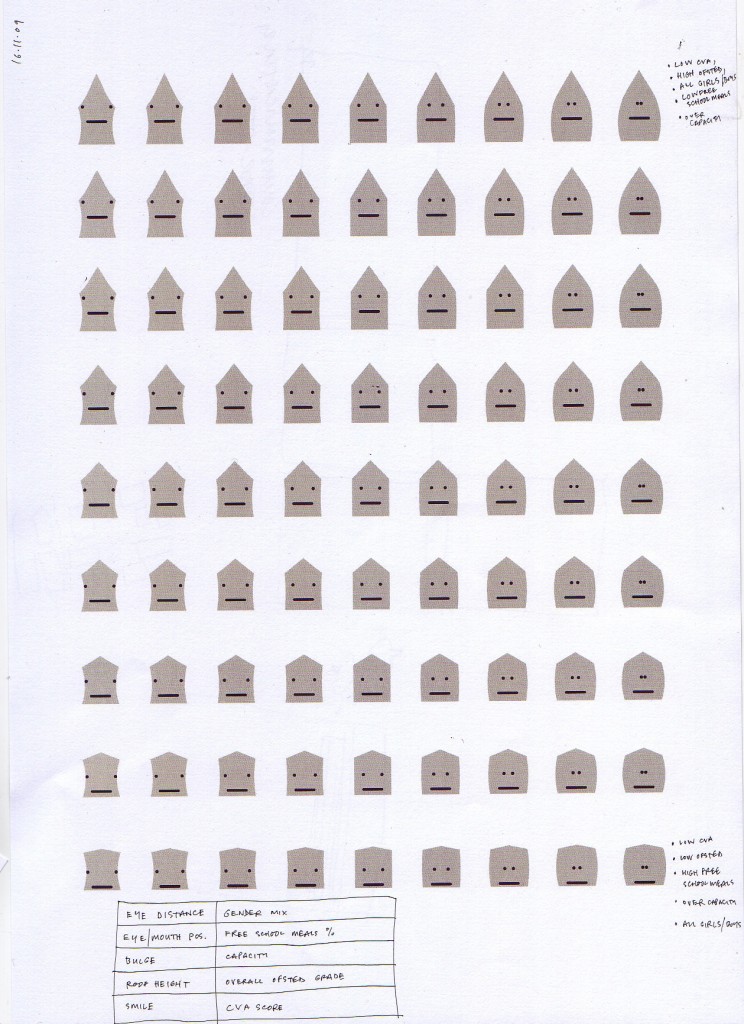
And imagining how an array of schools with different performance attributes might look like…

drawing_2009-11-16 1.jpeg

Whether they could appear in isometric 3D on maps or other contexts…

drawing_2009-11-20

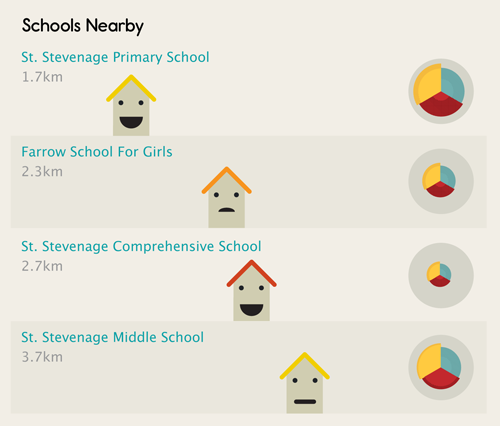
And how they might be practically used in some kind of comparison table…

chernoff-schools-nearby_500w

Since then Tom and Matt Brown have been playing with the data set and some elementary processing code – to give the us the first interactive, data-driven sketches of Chernoff Schools.

It’s still early days – but I think that the Chernoff Schools are an important step in Ashdown finding its character and positioning – in the same way as the city-colours and ‘sparklogos’ we came up with early on in Dopplr’s life were.

It’s as much a logo, a mascot and an endearing, ownable emblem as it is a useful visualisation.

I can’t wait to see how the team develops it over the coming months.

Toiling in the data-mines: what data exploration feels like

Matt’s mentioned in the past few summaries of weeks that I’ve been working on ‘material exploration’ for a project called Ashdown. I wanted to expand a little on what material exploration looks like for code and what it feels like to me, because it feels like a strange and foreign territory at times. This is my second material exploration of data for BERG, the first being at the beginning of the Shownar project.

There are several aspects to this post. Partly, it’s about what material explorations look like when performed with data. Partly, it’s about the role of code as a tool to explore data. We don’t write about code much on the site, because we’re mainly interested in the products we produce and the invention involved in them, but it’s sometimes important to talk about processes and tools, and this, I feel, is one of those times. At the same time, as well as talking about technical matters, I wanted to talk a little about what the act of doing this work feels like.

Programmers very rarely talk about what their work feels like to do, and that’s a shame. Material explorations are something I’ve really only done since I’ve joined BERG, and both times have felt very similar – in that they were very, very different to writing production code for an understood product. They demand code to be used as a sculpting tool, rather than as an engineering material, and I wanted to explain the knock-on effects of that: not just in terms of what I do, and the kind of code that’s appropriate for that, but also in terms of how I feel as I work on these explorations. Even if the section on the code itself feels foreign, I hope that the explanation of what it feels like is understandable.

Material explorations

BERG has done material explorations before – they were a big part of our Nokia Personalisation project, for instance – and the value of them is fairly immediate when the materials involved are things you can touch.

But Ashdown is a software project for the web – its substrate is data. What’s the value of a material exploration with an immaterial substrate? What does it look like to perform such explorations? And isn’t a software project usually defined before you start work on it?

Not always. Invention comes from design, and until the data’s been exposed to designers in a way that they can explore it, and manipulate it, and come to an understanding of what design is made possible by the data, there essentially is no product. To invent a product, we need to design, and to design, we need to explore the material. It’s as simple as that.

There’s a lot of value in this process. We know, at a high level, what the project’s about: in the case of Ashdown, Matt’s described it as “a project to bring great user experience to UK education data“. The high level pitch for the project is clear, but we need to get our hands mucky with the data to answer some more significant questions about it: what will it do? What will it feel like to use? What are the details of that brief?

The goals of material exploration

There are several questions that the material exploration of data seeks to answer:

  • What’s available: what datasets are available? What information is inside them? How easily are they to get hold of – are they available in formatted datasets or will they need scraping? Are they freely available or will they need licensing?
  • What’s significant: it’s all very well to have a big mass of data, but what’s actually significant within it? This might require datamining, or other statistical analysis, or getting an expert eye on it.
  • What’s interesting: what are the stories that are already leaping out of the data? If you can tell stories with the data, chances are you can build compelling experiences around it.
  • What’s the scale: getting a good handle on the order of magnitude helps you begin to understand the scope of the project, and the level of details that’s worth going into. Is the vast scale of information what’s important, or is it the ability to cherry-pick deep, vertical slices from it more useful? That answer varies from project to project.
  • What’s feasible: this goes hand in hand with understanding the scale; it’s useful to know how long basic tasks like parsing or importing data take to know the pace the application can move at, or what any blockers to a realistic application are. There is lots of scope to improve performance later, but knowing the limitations of processing the dataset early on helps inform design decisions.
  • Where are the anchor points: this ties into “what’s significant”, but essentially: what are the points you keep coming back to – the core concepts within the datasets, that will become primary objects not just in the code but in the project design?
  • What does it afford?: By which I mean: what are the obvious hooks to other datasets, or applications, or processes. Having location data affords geographical visualisation – maps – and also allows you to explore proximity; having details of Local Education Authorities allows you to explore local politics. What other ideas immediately leap into mind from exploring the data?

To explore all these ideas, we need to shape the data into something malleable: we need to apply a layer of code on the top of it. And it can’t just exist as code: we also need the beginnings of a website.

This won’t be the final site – or even the final code – but it’s the beginnings of a tool that can explain the data available, and help explore them, to designers, developers, and other project stakeholders, and that’s why it’s available, as early as possible, as an actual site.

To do this, the choice of tools used is somewhat important, but perhaps more important is the approach: keeping the code malleable, ensuring no decisions are too binding, and not editorialising. “Show everything” has become a kind of motto for this kind of work: because no-one else knows the dataset yet, it’s never worth deeming things “not worth sharing” yet. Everything gets a representation on the site, and then informed design decisions can be made by the rest of the team.

What does the code for such explorations look like?

It’s a bit basic. Not simple, but we’re not going to do anything clever: architecture is not the goal here. It will likely inform the final architecture, and might even end up being re-used, but the real goal is to get answers out of the system as fast as possible, and explore the scale of the data as widely as possible.

That means doing things like building temporary tables or throwaway models where necessary: speed is more important than normalisation, and, after all, how are you going to know how to structure the data until you’ve explored it?

Also, because we’re working on very large chunks of data, it’s important that any long running processes – scrapers, parsers, processors – need to be really granular, and able to pick up where they left off; my processing tasks usually only do one thing, and require running in order, but it’s better than one long complex process that can’t be restarted – if that falls over in the middle and can’t be restarted, it’s a lot of time (a valuable resource at these early stages) wasted.

It’s also important that there’s a suitably malleable interface to the data for you, the developer. For me, that’s a REPL/console of some sort – something slightly higher level than a MySQL terminal, that lets you explore codified representations of data (models) rather than just raw information. Shownar was built in PHP, and whilst it was, for many reasons, the right choice of platform for the project, I missed having a decent shell interface onto the system. On Ashdown, I’m working in Rails, and already the interactive console has made itself indispensable. For a good illustration of the succinct power of REPLs, and why they’re a useful thing to have around for data exploration, it’s definitely worth reading Simon Willison’s recent post on why he likes Redis.

Visualisation

Visualisation is a really important part of the material exploration process. When it comes to presenting our explorations, it’s not just enough to have big lists, and vast, RESTful interfaces on top of blobs of data: that’s still not a very effective translation of the stories the data tells. Right now, we don’t need to be fussy about what we visualise: it’s worth sticking graphs everywhere and anywhere we can, just to start exploring new representations of the data. It’s also useful to start learning what sort of visual representations suit the data: some data just doesn’t make as much sense in a graph as a table, and that’s OK – but it’s good to find out now.

Because now isn’t the time to be shaving too many yaks, when it comes to visualisation libraries and tools, the ones that are fastest or that you are most familiar with are probably the best. For that reason, I like libraries that only touch the client-side such as the Google Charts API, or gRaphael (which I’ve been using to good effect recently). Interactive graphs, of the kind gRaphael makes trivial, are more than just eye candy: it’s actually really useful, with large datasets, to be able to mouse around a pie chart and find out which slice corresponds to which value.

Visualisation isn’t just a useful lens on the data for designers; it can be hugely beneficial for developers. A recent example of the usefulness of visualisation for development work in progress comes from this video behind the scenes on Naughty Dog’s PS3 game Uncharted 2: Among Thieves. About twenty seconds in, you can see this image:

of a developer playing the game with a vast amount of telemetry overlaid, reacting as he plays. It’s not pretty, but it does provide an immediate explanation of how gameplay affects the processors of the console, and is clearly an invaluable debugging tool.

What data exploration feels like

It often feels somewhat pressured: time is tight and whilst an hour spend going down the wrong alley is fine, a day spent fruitlessly is somewhat less practical. At the same time, without doing this exploration, you won’t even know what is “fruitless”. It can be frightening to feel so directionless, and overcoming that fear – trusting that any new information is the goal – is tough, but important to making progress.

It can also be overwhelming. Shownar ended up with a massive dataset; Ashdown’s is huge already. That dataset – its meaning, its structure – gets stuck in your head, and it’s easy to lose yourself to it. That often makes it harder to explain to others – you start talking in a different langauge – so it becomes critical to get it out of your head and onto screens.

It also feels lonely in the data-mines at times. Not because you’re the only person working on it, but because no-one else can speak the language you do; the deeper you get into the data, the harder you have to work to communicate it, and the quicker you forget how little anyone else on the project knows.

Invention becomes difficult: being bogged down in the mechanics of Making It Work often makes it hard for me to have creative ideas about what you can do with that data, or new ways of looking at it. Questions from others help – a few simple questions about the data opens enough avenues to keep me busy all day. One thing we tried to do was ensure that I made a “new graph” every day; the graph should only take about 30 minutes to write the code and do, but it ensures that I don’t spend all my time on writing processing or scraping code.

At times, the code you’re writing can feel a bit string and glue – not the robust, Quality Code you’d like to be writing as a developer. I’d like to TATFT, but this isn’t the place for it: we’re sculpting and carving at the moment, and the time for engineering is later. For now, getting it on the screen is key, and sometimes, that means sacrifices. You learn to live with it – but just make sure you write the tests for the final product.

There are a lot of pregnant pauses. For Ashdown, I’ve had long-running processes running overnight on Amazon EC2 servers. Until I come in the next day, I have no idea if it worked, and even if it did work, whether or not it’ll be useful. As such, the work is bursty – there’s code, and a pause to gather results, and then a flurry of code, and then more gathering. All I’ve learned to date is: that’s the rhythm of exploration, and you learn to deal with it.

What emerges at the end of this work?

For starters, a better understanding of the data available: what there is, how to represent it, what the core concepts are. Sometimes, core concepts are immediately obvious – it’s likely that “schools” are going to be a key object in Ashdown. Sometimes, they’re compound; the core concept in Shownar turned out to be “shows”, but how the notion of a ‘show’ was represented in the data turned out to be somewhat complex. As part of these core concepts, the beginnings of a vocabulary for the application emerge.

Technically, you’ve got the beginnings of a codebase and a schema, but much of that might be redundant or thrown out in future; you shouldn’t bet on this, but it’s a nice side effect. You also might, as a side effect of building a site, have the beginnings of some IA, but again, don’t bet on it: that’s something for designers to work on.

You should also have a useful tool for explaining the project to colleagues, stakeholders, and anyone coming onto the project new – and that tool will allow everyone else to gain insight into just what’s possible with the data available. Enabling creativity, providing a tool for non-developers to explore the data, is the key goal of such exploration. And that leads into a direction and brief for the final piece of software – and it’s a brief that you can be confident in, because it’s derived from exploration of the data, rather than speculation.

And then, the invention can begin.
Ashdown: researcher wanted

As Webb has mentioned in this week’s update, I’m leading a project in the studio called Ashdown, which is in it’s very early stages.

One of the things we need is a researcher to undertake a small sub-project for a few weeks, to help us understand the territory we’re designing for.

Have a read of the mini-brief below. It might be you!

Introducing Ashdown
Ashdown is an information system we are developing – that will manifest in a number of products relating to the UK’s educational system. Each will be built on a combination of publicly-available data sources and be made unique by the quality and insight of its presentation. The products have a variety of potential audiences: from journalists and commentators to policy-makers, teachers and parents. Each one will be gorgeous.

What do we need
We need to build up a profile of these different audiences, particularly teachers and parents – around the UK. We are looking for a researcher who can do some quick field research and create a bundle of assets that can inform the design of our products: interviews, personas, videos, relationship maps. We want someone who can provide some analysis, synthesis and have some opinions also – that we can use in our process as designers.

Who we’re looking for
Probably an individual, probably someone based near London so we can spend time together, probably someone who knows people in or related to education (getting out and finding the right people around the UK is a must), and who is happy running this piece of work themselves, for us.

When / How
We would like to have a final report and assets by the end of November 2009, and we have a £1,000 budget + reasonable expenses put aside for this.

If you’re interested yourself get in touch with me: mj [at] berglondon.com, or if you know someone who might fit the bill – please do let them know about this opportunity.We’re looking to get started as soon as we can!

Recent Posts

Popular Tags