This website is now archived. To find out what BERG did next, go to www.bergcloud.com.

Blog (page 46)

Seeing the world

For the new faces; hello! I’m Georgina, and I spent the summer with BERG, conducting a social and economic history of the so-called ‘Silicon Roundabout’ community cluster around the Old Street area. The project itself is tying up, and we’ll be launching the stories document in January 2010. It’s been a summer of research and analysis.

How analysis works

At Reboot earlier this year, Matt talked about macroscopes: instruments that show where you are in the big context. That was an unexpected resonance for me: in making sense of my material, I’ve used my own analytical macroscope to see the social world and how the details of the microinstances shape the macroculture.

To begin, this is my macroscope – analysis is personal to the researcher and specific to the research context. There’s a lot of super-smart writing and consideration of different ways to do it, but no set definite procedure. My doctoral work – between 2003 and 2008 – was on technology communities in the adult entertainment industry, and in the course of that research, this is what I learned about the process of analysis:

  • Analysis isn’t a boxed-off process. Understanding how it all fits together doesn’t happen only at the end, sitting at a desk with the fieldnotes, interview transcripts and other material. It’s ongoing, from the opening research question to the fieldwork to the storytelling. It includes the codified and also the tacit – the hunches and ideas that hit in the downtime when three concepts tessellate together (often at either midnight or 6am).

  • Analysis is iterative. Because worlds are complex and full of stuff, the early stages of observation simply document (‘There are trade events’) rather than give definitive answers (‘There are trade events because…‘). But there are sparks in the descriptions – instances which are interesting because they happen frequently, or very rarely; because although they come unprompted from different places, they refer to a related thing (‘Community’, ‘network’, ‘family’, ‘Men’s club’, ‘incestuous’).

    Sparks can also be the interesting and the unexpected. They cluster together to light up the research question, illuminating what to find out more about: Is there a widespread sense of community? Do trade events create or maintain communities? Do communities affect innovative activities?. Sparks show the dark contrast too: Who is not in the community and why? If trade events are so important, who doesn’t go? And the loop goes around.

    But analysis is cautious. There are a lot of sparks, and there’s a danger in seeing patterns where there’s only random noise, or weighting one spark over others too much too early.

Analysis grows into themes

Analysis identifies abstract themes. Sparks represent ideas and concepts; given that, they can be collected into emergent categories that represent actual phenomena. And because sparks are complex and contain multitudes they can belong to many different themes; for instance, in my doctoral research, the ‘community’ sparks fitted into both the ‘We Are A Community‘ theme (collecting structures which create and maintain the social network of the industry) and ‘Technology How?‘ (collecting the ways technologies are built using input from the network).

Eventually, repeated events occur, routines are the same, the material becomes saturated and new sparks are infrequent. Throughout my research, the ‘Wild West’ story about the history of the industry came up again and again.

Analysis gives flesh to the themes by triangulating material from different sources against each other. The categories are filled out with finer and finer details. I found the boundaries and limits of the ‘We Are A Community‘ theme by asking questions until I was scraping at the edges: Who was in the community? How did they join? Where and when was the community maintained? How were communications created? Who wasn’t in the community? Where in physical/virtual space did the community ever converge?

Storytelling

In the end, analysis leads to storytelling. Each theme is a sheet of coloured acetate with a pattern on, beautiful and individual in its own right – but when they’re layered over each other, a picture emerges. Fitting the themes together tells the story of which answers the original question, and any others which have emerged along the way.

Like the analysis, storytelling is specific to the context: for the research on pornography, the story started at the macrolevel of industry and spun down into the microworld of people. For Old Street, and the upcoming January stories document, there are a number of ways to choose the adventure.

Week 231

We are joined this week by Matthew Irvine Brown! Check out his portfolio. He’s primarily working on design for Ashdown, and possibly on Kendrick. That makes five of us in the room now, and our first meeting with the Ashdown team all together was fantastic: great energy. I’m beginning to see the path from design aspirations to product.

Tom Armitage is occupied with Ashdown this week, deep into scraping data. He’s editing a short article the blog this week too, by Georgina Voss, updating us about her ethnography on Silicon Roundabout. Matt Jones is on Ashdown, helping with the Bonnier project, following up a little biz dev, and is today at the RCA as part of his ongoing involvement in the Design Interactions brief on the future of manners.

Schulze is working with a little team on interaction design and video evidencing for Bonnier. Then he’s off to New York for a meeting or two and to speak at the Idea Conference. Schulze is away in Stockholm and maybe Oslo next week too, and it’s always tricky to have one of us away: it’s quite a delicate design sense we’re developing between us all here, and it’s one that’s fostered by working together, co-located, constantly pitching in, debating, sketching and sharing. That’s what makes it a studio I suppose. And it’s something I’d like to protect, especially in these early days, but there’s a balance to be struck. Travelling also means fresh eyes and new perspectives.

I’m liaising with builders to get quotes for the conversion of the new studio space, with accountants to answer queries on the year end and move to better book-keeping software, and researchers for: Ashdown; Silicon Roundabout; cybernetics. There are two contracts to chase and two proposals to complete. I know I say this every three months or so, but I’m busier and more productive than I’ve ever been. Last week we hosted drinks for our friends, in honour of Laika, and I got to say a few words about beginnings in general (and science fiction, of course). It’s exciting.

Oh, and there’s some new basic stuff on this site: new projects and a new talk.

I want to say something about these weekly updates, which I have now tagged ‘weeknotes’ at the inspiration of Bryan Boyer who also writes weekly updates. Kicker Studio summarise their weekly activity; Six to Start are occasional diarists; and our friends at Stamen this week posted about their first week at their new HQ. I love these.

An active blog is like a green activity light in instant messaging. For those of us who aren’t habitual bloggers, week notes help the process become regular. But more than that, companies are so often opaque. I write here whatever’s going on and whatever’s on my mind, and make connections I didn’t expect with readers I didn’t know I had. Little doors open to empathy. Running a small company is both hard and the best thing in the world. These week notes act as a kind of diary of reflections for me – I find writing them personally helpful – but they also trigger conversations with friends in similar situations about what they’ve seen before and what they’ve learned. I’d love for more companies and studios like us to keep week notes. I learn a lot, both writing and reading them, and it satisfies my nosiness as to what’s actually going on.

Links for a Monday Morning

  • wikireader.jpg
    How come I’d never heard of WikiReader before? It’s a $99 device for reading Wikipedia from a memory card. There’s no network connection of any form, just a micro-SD slot, meaning it’ll last for a year on three AA batteries. You can update it at any point by downloading a new dump; if that’s not possible, you can get a new dump sent to you on a memory card for a small fee. It’s got a touch-screen, so the UI doesn’t have to be localised – foreign keyboards can be implemented in software. And, best of all, it has a hardware button marked “Random” – capturing one of the hidden joys of Wikipedia.

    It feels like a nice companion to an e-reader: book in one hand, universal lookup device in the other, and not a network connection in site. The chunky form-factor also makes it really robust and immediate; something I’d consider slinging in a bag, especially for trips abroad. It’s designed by Openmoko, and available now.

  • oomouse81.pngAnother open-source product making its debut in hardware is the OpenOffice.org Mouse (pictured left). Eighteen buttons, an analogue joystick… I admit to sucking my teeth in disbelief when I first saw it; the comparisons that have been made to the Homer seem justified.

    But take a step back, and consider it more slowly, and perhaps it’s not the car-crash it seems; instead, its problems are more subtle. Chris Messina has a sharp takes on this:

    What I worry about, however, is that pockets of the open source community continue to largely be defined and driven by complexity, exclusivity, technocracy, and machismo… so far I’ve see little indication that open source developers take seriously the need for simpler, easier, and more intuitive future-forward interfaces. Perhaps I’m wrong or just uninformed, but so long as products like the OpenOfficeMouse continue to characterize the norm in open source design, I’m not likely going to be able to soon recommend open source solutions to anyone but the most advanced and privileged users.

    Friend of BERG Phil Gyford picks up a similar point:

    The problem isn’t that it has appalling design — it’s poor and uninspired, but it’s not the worst thing ever.

    The fundamental problem is that the product is aiming for two very specific, probably unreconcilable, niche audiences (hard-core gamers and hard-core office workers) while associating itself with a brand (OpenOffice) that wants to be completely mainstream.

    I think Phil’s right. If this was pitched as, say, an EVE Online mouse, I’d probably go “oh, that makes sense for a game and UI that complex”. But for a brand trying to be taken seriously as a mainstream alternative to expensive office suites, this seems misguided, and only perpetuates preconceived notions of Open Source’s attitude towards design.

  • Schulze has bought a new car, and trust him to buy the only car I’ve seen with its own font. That is: not a font designed for the car, but a font made by the car.

    Toyota motion-captured an iQ from overhead using software written in openFrameworks, and used it to generate a handwriting font built out of careful cornering and handbrake turns. It feels like the opposite of DHL’s fake GPS art: Toyota are keen to show the software and prove it actually works. Best of all, they’ll even let you download – and use – the font itself.

  • I couldn’t let a round-up of links go with a mention to James Bridle’s recreation of MENACE, Donald Michie‘s learning machine to play noughts-and-crosses built only out of matchboxes and beads, which he first demonstrated at Playful two weeks ago.

    James was kind enough to bring his MENACE to a recent BERG drinks evening, and it drew the gasps it thoroughly deserves; 301 matchboxes is an imposing piece of computing.

  • And, finally, a nice little piece of what you might call design research: Giles Turnbull investigates nomenclatures for legobricks, surveying a selection of children he knows:

    This language of Lego isn’t just something our family has invented; every Lego-building family must have its own vocabulary. And the words they use (mostly invented by the children, not the adults) are likely to be different every time. But how different? And what sort of words?

    Hence, a survey. I asked fellow parents to donate their children for a few minutes, and name a selection of Lego pieces culled from the Lego parts store.

    Lovely. (Personally, I called a Brick 1×1 a “one-bobble” and a plate 1×1 a “flat one-bobble”).

Tangled histories

wykobi_quadratic_bezier_intersection

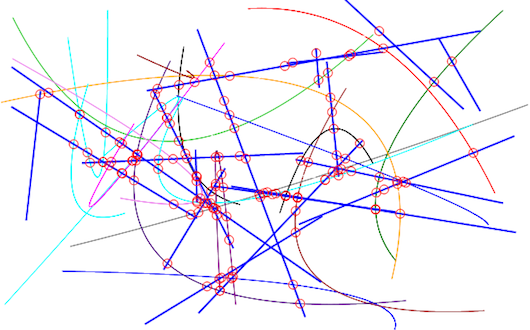
I saw Brian Eno and Steven Johnson in conversation on Monday night at the ICA, and Johnson talked about an approach he calls the long zoom or maybe consilience. The invention of air (the subject of his book) must take in the context of the Enlightenment; the energy and machines released by the Industrial Revolution; discussions, letters and social relations; and the shift from alcohol to coffee. All scales interconnect. None determine.

I enjoy these interwoven histories. In Pandora’s Hope, Bruno Latour tells how Pasteur and microbes bring each other to life, buttressed by laboratory experiments and arguments in letters to other scientists. Pasteur, microbes and instruments each have their own capacities to act and collaborate, and it’s only in their actions that we remember any of them; that history is made.

Yesterday morning I had an exciting meeting with a potential cybernetics researcher. I hope it works out. We found tight knots and long arcs: gnosis, McLuhan, Shannon’s information theory, mind/body, and Neuromancer; racism, eugenics, Mead, post-structuralism; prosthetics and body modification.

movie_narrative_charts_large

Listopad

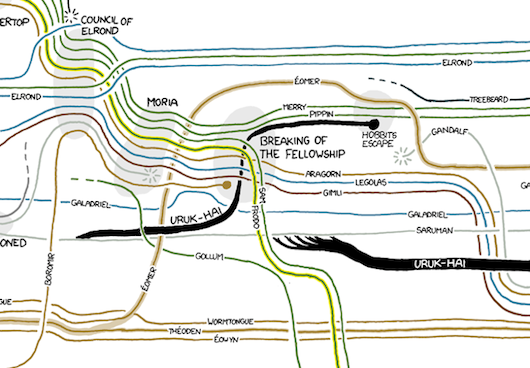
We’re now 20 years after the Prague Revolution of November 1989, that threshold year for modern Europe. It is a tangled history: all views of the events are partial and are often contradictory. No single factor determines. Historical trajectories lasting five decades are as important as lies told to credulous protestors, and as important as an invisible-to-us political game played between the secret police of Soviet Russian and Czechoslovakia. All we can do is tell stories.

The Prague revolution is a history best seen as constructive interference; a kind of aleph moment of trajectories and events; a cloud formation in a particular spot brought about by humidity and foliage and gaps in the clouds, a nest or complex of feedback loops; a self-reinforcing discontinuity.

Some years ago I made a timeline from journals and journalism I could find online. 1989 is right at the beginning of online personal narrative, which is one of the qualities that attracted me. In the end I wrote a story about Martin Smid, the student who didn’t die, but whose death at the hands of the police catalysed the revolution: Listopad, Prague 1989.

I don’t know why I write this. I’m interested in tangles and multi-actor histories, and how you tell stories in them. Books are for the linearisable. Hypertext is for hyperhistories. I’m curious about how simple patterns in behaviours or social relationships somehow persist, complexify and grow over decades and hundreds of thousands of people, and somehow don’t die away.

That’s one of the reasons I’m interested in cybernetics — surely it’s important, the weird individual relationships, the probes into the nature of being human, the mix of countercultural and military-industrial, the attitudes and ideas, all fermenting in the bottleneck population that contributed so much to modern culture? Surely those patterns persisted and weren’t diluted, and will throw light on the here and now? Beginnings matter.

Week 230

Last week’s financial modelling resulted in a graph of the company’s invoices and cash receipts back to July 2007. I can read my feelings off it month by month: there’s an early year of maintaining one big consultancy gig per quarter coupled with a single long running project. Good. I can read a year ago, November 2008, the beginning of the time I called the Dayuejin – the Great Leap Forward – when we decided to begin to grow. The following six months are spiky: there’s a month of cash followed by a month of drought and hunting for work, and the pattern repeats. Looking at the chart I can remember the inclines and angles of the lines in my legs. It feels like hiking.

It’s satisfying to see this present epoch, the Escalante, made literal in grey and blue. In July 2009 the oscillations finish and we’re at base-camp of a steady climb. The climb won’t last forever, maybe until February next year: at that point I’m aiming for the company to be turning over nicely; cash, business development, work, R&D, exploitation, marketing, growth all running steadily, at comfortable capacity, and together, without stuttering or misfiring. It’s that operational foundation that enables products. New product development and client services live hand in hand: in expertise, ideas, attention and freedom. So I have my eye on what it will mean to achieve the Escalante – and what comes afterwards – and I’m working on building the right structures and bringing in the right projects to make that happen.

That’s the big picture. Weminuche is a big part of what happens post Escalante. And the new studio. And the people. And, and, and. But from here to there…

I guess we’re a product design company, whether it’s for Web, mobile, print, networks or consumer electronics. “Product” for us means something which you can attach marketing messages to, that has a business model in it, that has goals and success criteria, that you can rally a team behind, that is coherent to the consumer… services, content, community and experience are immaterials that we work with, intrinsically, but frankly: if you can’t say what it is in a sentence and you can’t sell it, why should we make it or why should anyone else pay us to make it? We like to make products designed to be part of social lives and part of society.

Now as part of the invention process there are weird and often gorgeous experiments and explorations. But I’m pleased to be able to say that the Here & There maps did well commercially, in addition to coming out of a long-running research project, and the collaborations with Touch succeeded in the marketplace of attention. You gotta get to market to know whether what you’re doing is any good.

I don’t know, maybe I’m being unnecessarily dogmatic, but the idea of “product” is a thread that runs through a lot of our work, and I’m trying to think through and unpack what we really mean by that.

Anyway. The projects we’re working on right now – primarily Ashdown and consulting with Bonnier – have to be considered as products (with service layers! Living in our social groups!), and executed with inventiveness and beauty and popularity.

And the two projects I mentioned at the end of week 229, they have to be about inventiveness and beauty and popularity too. A quick update on those: it was a great Friday last week. We have codenames for both now. I’ve commented on a draft of the contract for Walnut. And on Kendrick we’ve agreed budgets and the engagement fee, and we’re waiting to see the contract and PO. Massively exciting.

I should say what we’re up to this week…

Schulze and Matt are working with Bonnier at the beginning of this week. Schulze will move onto organising builders for the new studio, and planning how we invest in the development of two products of our own. He’s also working on pitching Weminuche, and helping with Ashdown.

Matt Jones will focus on Ashdown. It’s an Ashdown week in the studio: everyone has something to do. I’m going to rustle up some meetings, Tom is building scrapers for data and making more visualisations, and Matt is leading the design effort. Matt Brown, previously Lead Interaction Designer at Last.fm, is joining us to work on this (and other things) for a few months, and he’s starting next Monday: it’s super exciting and a big moment for us, and we’re prepping the ground so he can get off to a flying start.

Three Matts. This is going to be confusing.

Tom’s also writing for the website this week. We need to keep an eye on general marketing because of how busy we’re going to be on projects for the next couple months. If the website’s not growing, that’ll bite us come February.

I’m on contracts, pitches, interviewing, and bedding down the new operations infrastructure we now need. For instance: we have an intranet. The long ascent of the Escalante always comes back to the moment by moment. If it’s true, that behind the mountains there are mountains, then you shouldn’t climb only for the view, but for the climb itself. Make every step satisfying.

Week 229

Tom is on holiday. Matt Jones was with the RCA Design Interactions programme on Monday launching a brief on the Future of Etiquette, in collaboration with T-Mobile. He’s currently in Berlin with that. Aside from that: Ashdown; helping Schulze with Bonnier; gentle biz dev.

Schulze is gently biz deving too, on top of developing last week’s low fi video prototypes for Bonnier with Campbell Orme, more Ojito designs and costings, and organising building works for the new studio.

I’m using this brief moment of calm to catch up on emails, writing, pitches and chores, and to build simple financial models of the company to give us a better view on the next couple of quarters. It’s got too complex to manage from looking at the books and invoices. The consequences of not doing certain kinds of biz dev or not watching cash or growth don’t become apparent for a few months. So: spreadsheets. I have to admit, I enjoy it.

(Also I’m holding my breath over two projects I’d really love for us to land this week. Don’t tell anyone I get this nervous.)

“All the time in the world” talk at Design By Fire 2009, Utrecht

My talk at DxF2009 in Utrecht last week was an hour’s wander around the idea of Time, particularly historical and cultural ideas of time.

My focus was time as a material for interaction design that we should deconstruct and reconstruct in order to create products and services that take advantage of new real-time web technologies.

Toiling in the data-mines: what data exploration feels like

Matt’s mentioned in the past few summaries of weeks that I’ve been working on ‘material exploration’ for a project called Ashdown. I wanted to expand a little on what material exploration looks like for code and what it feels like to me, because it feels like a strange and foreign territory at times. This is my second material exploration of data for BERG, the first being at the beginning of the Shownar project.

There are several aspects to this post. Partly, it’s about what material explorations look like when performed with data. Partly, it’s about the role of code as a tool to explore data. We don’t write about code much on the site, because we’re mainly interested in the products we produce and the invention involved in them, but it’s sometimes important to talk about processes and tools, and this, I feel, is one of those times. At the same time, as well as talking about technical matters, I wanted to talk a little about what the act of doing this work feels like.

Programmers very rarely talk about what their work feels like to do, and that’s a shame. Material explorations are something I’ve really only done since I’ve joined BERG, and both times have felt very similar – in that they were very, very different to writing production code for an understood product. They demand code to be used as a sculpting tool, rather than as an engineering material, and I wanted to explain the knock-on effects of that: not just in terms of what I do, and the kind of code that’s appropriate for that, but also in terms of how I feel as I work on these explorations. Even if the section on the code itself feels foreign, I hope that the explanation of what it feels like is understandable.

Material explorations

BERG has done material explorations before – they were a big part of our Nokia Personalisation project, for instance – and the value of them is fairly immediate when the materials involved are things you can touch.

But Ashdown is a software project for the web – its substrate is data. What’s the value of a material exploration with an immaterial substrate? What does it look like to perform such explorations? And isn’t a software project usually defined before you start work on it?

Not always. Invention comes from design, and until the data’s been exposed to designers in a way that they can explore it, and manipulate it, and come to an understanding of what design is made possible by the data, there essentially is no product. To invent a product, we need to design, and to design, we need to explore the material. It’s as simple as that.

There’s a lot of value in this process. We know, at a high level, what the project’s about: in the case of Ashdown, Matt’s described it as “a project to bring great user experience to UK education data“. The high level pitch for the project is clear, but we need to get our hands mucky with the data to answer some more significant questions about it: what will it do? What will it feel like to use? What are the details of that brief?

The goals of material exploration

There are several questions that the material exploration of data seeks to answer:

  • What’s available: what datasets are available? What information is inside them? How easily are they to get hold of – are they available in formatted datasets or will they need scraping? Are they freely available or will they need licensing?
  • What’s significant: it’s all very well to have a big mass of data, but what’s actually significant within it? This might require datamining, or other statistical analysis, or getting an expert eye on it.
  • What’s interesting: what are the stories that are already leaping out of the data? If you can tell stories with the data, chances are you can build compelling experiences around it.
  • What’s the scale: getting a good handle on the order of magnitude helps you begin to understand the scope of the project, and the level of details that’s worth going into. Is the vast scale of information what’s important, or is it the ability to cherry-pick deep, vertical slices from it more useful? That answer varies from project to project.
  • What’s feasible: this goes hand in hand with understanding the scale; it’s useful to know how long basic tasks like parsing or importing data take to know the pace the application can move at, or what any blockers to a realistic application are. There is lots of scope to improve performance later, but knowing the limitations of processing the dataset early on helps inform design decisions.
  • Where are the anchor points: this ties into “what’s significant”, but essentially: what are the points you keep coming back to – the core concepts within the datasets, that will become primary objects not just in the code but in the project design?
  • What does it afford?: By which I mean: what are the obvious hooks to other datasets, or applications, or processes. Having location data affords geographical visualisation – maps – and also allows you to explore proximity; having details of Local Education Authorities allows you to explore local politics. What other ideas immediately leap into mind from exploring the data?

To explore all these ideas, we need to shape the data into something malleable: we need to apply a layer of code on the top of it. And it can’t just exist as code: we also need the beginnings of a website.

This won’t be the final site – or even the final code – but it’s the beginnings of a tool that can explain the data available, and help explore them, to designers, developers, and other project stakeholders, and that’s why it’s available, as early as possible, as an actual site.

To do this, the choice of tools used is somewhat important, but perhaps more important is the approach: keeping the code malleable, ensuring no decisions are too binding, and not editorialising. “Show everything” has become a kind of motto for this kind of work: because no-one else knows the dataset yet, it’s never worth deeming things “not worth sharing” yet. Everything gets a representation on the site, and then informed design decisions can be made by the rest of the team.

What does the code for such explorations look like?

It’s a bit basic. Not simple, but we’re not going to do anything clever: architecture is not the goal here. It will likely inform the final architecture, and might even end up being re-used, but the real goal is to get answers out of the system as fast as possible, and explore the scale of the data as widely as possible.

That means doing things like building temporary tables or throwaway models where necessary: speed is more important than normalisation, and, after all, how are you going to know how to structure the data until you’ve explored it?

Also, because we’re working on very large chunks of data, it’s important that any long running processes – scrapers, parsers, processors – need to be really granular, and able to pick up where they left off; my processing tasks usually only do one thing, and require running in order, but it’s better than one long complex process that can’t be restarted – if that falls over in the middle and can’t be restarted, it’s a lot of time (a valuable resource at these early stages) wasted.

It’s also important that there’s a suitably malleable interface to the data for you, the developer. For me, that’s a REPL/console of some sort – something slightly higher level than a MySQL terminal, that lets you explore codified representations of data (models) rather than just raw information. Shownar was built in PHP, and whilst it was, for many reasons, the right choice of platform for the project, I missed having a decent shell interface onto the system. On Ashdown, I’m working in Rails, and already the interactive console has made itself indispensable. For a good illustration of the succinct power of REPLs, and why they’re a useful thing to have around for data exploration, it’s definitely worth reading Simon Willison’s recent post on why he likes Redis.

Visualisation

Visualisation is a really important part of the material exploration process. When it comes to presenting our explorations, it’s not just enough to have big lists, and vast, RESTful interfaces on top of blobs of data: that’s still not a very effective translation of the stories the data tells. Right now, we don’t need to be fussy about what we visualise: it’s worth sticking graphs everywhere and anywhere we can, just to start exploring new representations of the data. It’s also useful to start learning what sort of visual representations suit the data: some data just doesn’t make as much sense in a graph as a table, and that’s OK – but it’s good to find out now.

Because now isn’t the time to be shaving too many yaks, when it comes to visualisation libraries and tools, the ones that are fastest or that you are most familiar with are probably the best. For that reason, I like libraries that only touch the client-side such as the Google Charts API, or gRaphael (which I’ve been using to good effect recently). Interactive graphs, of the kind gRaphael makes trivial, are more than just eye candy: it’s actually really useful, with large datasets, to be able to mouse around a pie chart and find out which slice corresponds to which value.

Visualisation isn’t just a useful lens on the data for designers; it can be hugely beneficial for developers. A recent example of the usefulness of visualisation for development work in progress comes from this video behind the scenes on Naughty Dog’s PS3 game Uncharted 2: Among Thieves. About twenty seconds in, you can see this image:

of a developer playing the game with a vast amount of telemetry overlaid, reacting as he plays. It’s not pretty, but it does provide an immediate explanation of how gameplay affects the processors of the console, and is clearly an invaluable debugging tool.

What data exploration feels like

It often feels somewhat pressured: time is tight and whilst an hour spend going down the wrong alley is fine, a day spent fruitlessly is somewhat less practical. At the same time, without doing this exploration, you won’t even know what is “fruitless”. It can be frightening to feel so directionless, and overcoming that fear – trusting that any new information is the goal – is tough, but important to making progress.

It can also be overwhelming. Shownar ended up with a massive dataset; Ashdown’s is huge already. That dataset – its meaning, its structure – gets stuck in your head, and it’s easy to lose yourself to it. That often makes it harder to explain to others – you start talking in a different langauge – so it becomes critical to get it out of your head and onto screens.

It also feels lonely in the data-mines at times. Not because you’re the only person working on it, but because no-one else can speak the language you do; the deeper you get into the data, the harder you have to work to communicate it, and the quicker you forget how little anyone else on the project knows.

Invention becomes difficult: being bogged down in the mechanics of Making It Work often makes it hard for me to have creative ideas about what you can do with that data, or new ways of looking at it. Questions from others help – a few simple questions about the data opens enough avenues to keep me busy all day. One thing we tried to do was ensure that I made a “new graph” every day; the graph should only take about 30 minutes to write the code and do, but it ensures that I don’t spend all my time on writing processing or scraping code.

At times, the code you’re writing can feel a bit string and glue – not the robust, Quality Code you’d like to be writing as a developer. I’d like to TATFT, but this isn’t the place for it: we’re sculpting and carving at the moment, and the time for engineering is later. For now, getting it on the screen is key, and sometimes, that means sacrifices. You learn to live with it – but just make sure you write the tests for the final product.

There are a lot of pregnant pauses. For Ashdown, I’ve had long-running processes running overnight on Amazon EC2 servers. Until I come in the next day, I have no idea if it worked, and even if it did work, whether or not it’ll be useful. As such, the work is bursty – there’s code, and a pause to gather results, and then a flurry of code, and then more gathering. All I’ve learned to date is: that’s the rhythm of exploration, and you learn to deal with it.

What emerges at the end of this work?

For starters, a better understanding of the data available: what there is, how to represent it, what the core concepts are. Sometimes, core concepts are immediately obvious – it’s likely that “schools” are going to be a key object in Ashdown. Sometimes, they’re compound; the core concept in Shownar turned out to be “shows”, but how the notion of a ‘show’ was represented in the data turned out to be somewhat complex. As part of these core concepts, the beginnings of a vocabulary for the application emerge.

Technically, you’ve got the beginnings of a codebase and a schema, but much of that might be redundant or thrown out in future; you shouldn’t bet on this, but it’s a nice side effect. You also might, as a side effect of building a site, have the beginnings of some IA, but again, don’t bet on it: that’s something for designers to work on.

You should also have a useful tool for explaining the project to colleagues, stakeholders, and anyone coming onto the project new – and that tool will allow everyone else to gain insight into just what’s possible with the data available. Enabling creativity, providing a tool for non-developers to explore the data, is the key goal of such exploration. And that leads into a direction and brief for the final piece of software – and it’s a brief that you can be confident in, because it’s derived from exploration of the data, rather than speculation.

And then, the invention can begin.

BERG featured in UKTI/Monocle creative industries survey

monocle_BERG_coverpamphlet

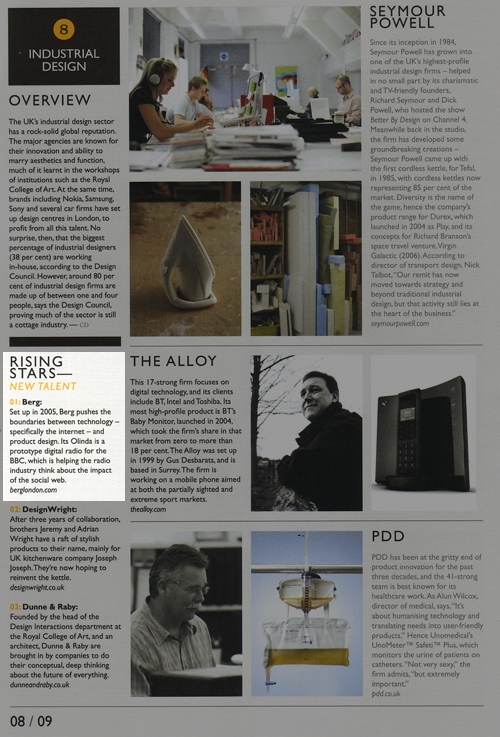
We’re extremely happy to be included alongside friends and colleagues such as SixToStart, Poke and Dunne & Raby – as well as in the company of such established design industry heavyweights as SeymourPowell in the UK Trade & Investment “Creative Industries” supplement in November’s Monocle magazine.

Monocle_BERG

Cybernetics: researcher wanted

I’m into cybernetics. Or rather: I think that the cybernetics movement of mid last century is the hidden nexus of interconnected postwar history.

cybenetics interconnections

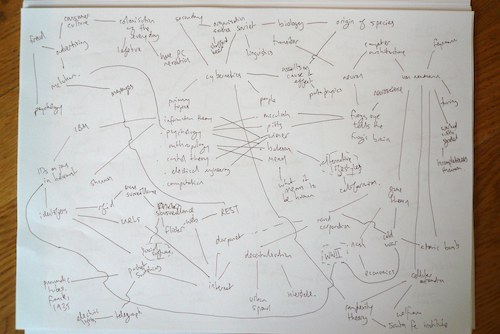
The 1946 Macy Conference is kind an aleph moment. In attendance were people intrinsically involved in computers and prosthesis (the collaboration of man and machine), modern anthropology and modern neuroscience (what it means to be human), game theory (the Cold War and the conversion of people into cogs). We can trace direct paths through counterculture and social organisation, decentralisation and the Web, and to a socialist Chilean internet. There are connections to cults, advertising, social software and games, rocketry, suburbia, complexity theory and ecology. Historical roots lie in golems and pneumatic tubes, science fiction and weaving, pataphysics and the telegraph. The language of our information society was created, often knowingly, by these people. Cybernetics is the beautiful and ugly and ambiguous heart of our information society.

I have a dozen or so books in my collection that directly speak about these era. Two that stand out are both by Steve Joshua Heims: Constructing a Social Science for Postwar America: The Cybernetics Group, 1946-1953; and John von Neumann and Norbert Wiener: From Mathematics to the Technologies of Life and Death.

What’s wonderful about this history is that it’s a history of people. It’s all people who know people. The messy social world of this invented science that then vanishes undermines its own contention that humans can be modelled as components. It is a story that cannot be linearised, it is a hypertext history; a hyperhistory of actors and networks, only tellable through contradictory, subjective points of view. Yet there are aspects of known history that, I believe, only make sense when you see the hidden particle traces, the lives of the attendees of the Macy Conferences and who they knew.

It has been a pet project of mine, for a few years, to somehow tell this story. Many of the key participants are no longer with us. Understanding the modern world, in this time of change, is important. It should be known that common practices in our innocuous online spaces were thrashed out as military efforts. Conversely it should be known that the mindset computers were borne out of was reactionary and weird and perverse from the very outset.

Help wanted

I’d like some help assembling the research. I’m not sure precisely where it’ll go – for a while I thought I’d write a book, and now I have other ideas – but what I do know is that I’d like to work with a researcher for 3-6 months to turn books, articles and references into research notes: the foundation for future work.

I have a starting set of books, and a pretty clear idea of what I need as output (one reference point is Anne Galloway’s re/touch encyclopaedia). If you’re the researcher I’d like to work with, you’re already knowledgeable about postwar America and one or two of the topics associated with cybernetics. You’re good with book research, following leads like a hungry investigative journalist, and diligent with references. You’re probably in research academia in an allied field, and you may have your own use for this work. This is a part-time job, and it’s maybe another small piece of funding for you. You’ll be a self starter, and glory in interconnections and libraries both.

Why am I talking about this in public? Well, I don’t know the right researcher. Is this you, or is it someone you know? It’s speculative work – just following my nose – and I can put about £3,000-5,000 aside. If you’d like to have a chat, please do get in touch.

Recent Posts

Popular Tags