This website is now archived. To find out what BERG did next, go to www.bergcloud.com.

Blog posts tagged as 'visualisation'

BERG x Ericsson: ‘Joyful net work’ and Murmurations

Ericsson’s UX Lab have recently been doing some important and brave work around the Internet of Things. We have been particularly intrigued by their concept of using social networks as a model to understand complex networks.

This is smart, it builds on our innate familiarity with social networks, but also acts as a provocation for us to think differently about the internet of things. It also happens to cross over with many of the BERG’s interests including Little Printer, BERGCloud and very close to the ‘Products are people too‘ concept that has been guiding much of our work.

14 March, 17.46

So over the last few months BERG and Ericsson have been working in partnership to explore some practical and poetic approaches to networks and smart products. We have been developing concepts around the rituals and rhythms of life with connected things, and creating some visualisations based on network behaviours. Phase 1 of this project is complete, and although we can’t talk about the entire project, we thought it would be good to show some of our first sketches.

You can also read more about the collaboration from Ericsson’s perspective here.

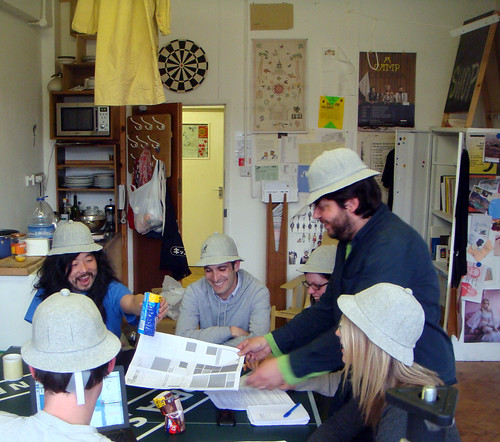
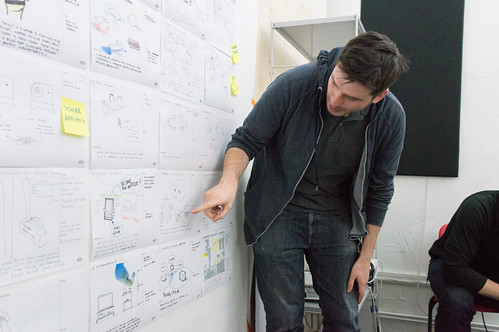
We kicked off in a product invention workshop where some really strong themes emerged.

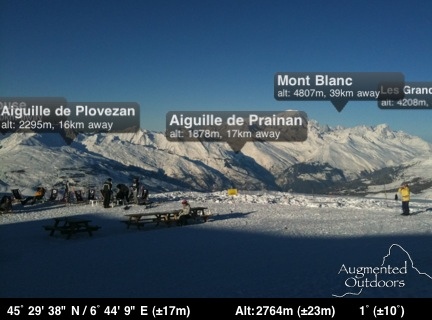
There are huge areas of network-ness, from the infrastructure to the protocols, from the packets to the little blinking lights on our routers, that are largely ‘dark matter‘: immaterial and invisible things that are often misunderstood, mythologised or ignored.

There are a few long-term efforts to uncover the physical infrastructure of our networks. Ericsson itself has long understood the need to both explain the technology of networks and their effects.

But – we mostly feel like the network is out of our control – tools to be able to satisfyingly grasp and optimise our own networks and connected products aren’t yet available to us. Working towards products, services and visualisations that make these things more legible and tangible is good!

Joyful (net)work: Zen Garden Router

2012-03-18 | 20-31-44

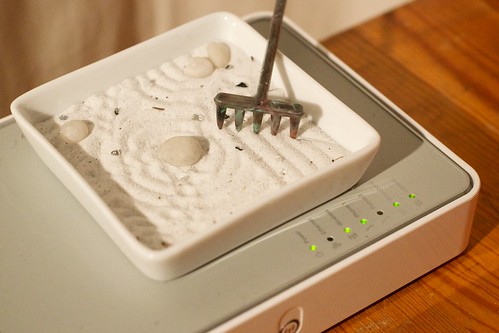
Inspired by Matt Jones’ idea of a ‘Zen garden router’ this video sketch focuses on the ongoing maintenance and ‘tuning’ of a domestic ecosystem of connected products, and the networks that connect them. We have modified a standard router with a screen on its top surface, to make network activity at various scales visible and actionable at the point at which it reaches the house. We’ve used a version of the beautiful ‘Toner’ maps by our friends at Stamen in the design.

This looks to metaphors of ‘joyful work’ that we engage with already domestically – either mechanisms or rituals that we find pleasurable or playful even if they are ‘work’. Here there are feedback mechanisms that produce more affect and pleasure – for instance the feedback involved in tuning a musical instrument, sound system or a radio. Gardening also seems to be a rich area for examination – where there is frequent work, but the sensual and systemic rewards are tangible.

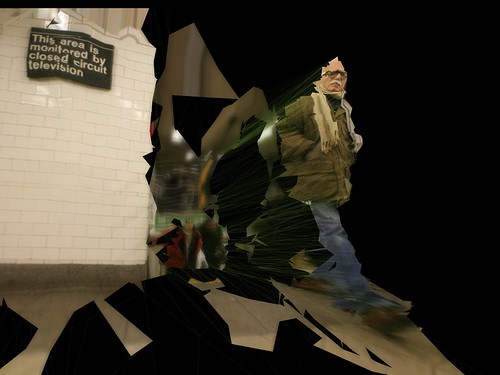
Network Murmurations

Different network activity has vastly different qualities. This is an experiment using projection mapping to visualise network activity in the spaces that the network actually inhabits.

When loading a web page a bunch of packets travel over WiFi in a dense flock. While playing internet video packets move in a dense stream that persists as long as the video is playing. On the other end of the scale a Bluetooth mouse or a Zigbee light switch where tiny, discrete amounts of data flow infrequently. Then there are ‘collisions’ in the network flow or ‘turbulence’ created by competing devices such as microwaves or cordless phones.

We use as inspiration a ‘murmuration‘ of starlings, a beautiful natural phenomenon. In this visualisation the ‘murmuration’ flits between devices revealing the relationships and the patterns of network traffic in the studio. Although this sketch isn’t based on actual data on network traffic, it could be, and it seems that there is great scope in bringing more network activity to our attention, giving us a sense of its flows and patterns over time.

The network is part of our everyday lives. Seeing the network is the first step to understanding the network, acting on it, and gaining an everyday literacy in it. So what should it look like? These video sketches are part of our ongoing effort to find out – a glimpse of our first phase of research, there is more work in the pipeline that we hope to be able to talk about soon.

Thanks to the Ericsson’s UX Lab for being great R&D partners.

BBC Dimensions: How Many Really?

Update, February 2013: Howmanyreally.com has now finished its prototype trial, and is no longer live.


About two years ago, we started work with Max Gadney on a series of workshops looking at how digital media could be used for relating stories and facts from both history and current affairs.

One of the concepts was called ‘Dimensions’ – a set of tools that looked to juxtapose the size of things from history and the news with things you are familiar with – bringing them home to you.

About a year ago, we launched the first public prototype from that thinking, http://howbigreally.com, which overlaid the physical dimensions of news events such as the 2010 Pakistan Floods, or historic events such as the Apollo 11 moonwalks on where you lived or somewhere you were familiar with.

It was a simple idea that proved pretty effective, with over half-a-million visitors in the past year, and a place in the MoMA Talk To Me exhibition.

Today, we’re launching its sibling, howmanyreally.com

BBC Dimensions: How Many Really

You can probably guess what it does from the URL – it compares the numbers of people who experienced an event with a number you can relate to: the size of your social network.

For example, the number of people who worked at Bletchley Park cracking codes and ushering in the computer age…

bletch_home

I can sign in with my Twitter account

bletch_1

and I’m placed at the centre…

bletch_2

Clicking to zoom out shows me in relation to those I follow on Twitter…

bletch_3

Zooming out again places that group in relation to those working at Bletchley Park in 1945.

bletch_4

Which, in turn, is then compared to the Normandy Landings

bletch_5

…and finally the 1.5m people in the Home Guard

bletch_6

Despite the difference between the size of the final group and your social network, it can still just be made out at the centre of the diagram, helping us imagine the size of the group involved in these efforts during World War 2.

Of course this visualisation owes much to the pioneering work of the Office of Charles & Ray Eames – particularly their “Powers of 10” exploration of relative scale, which is a shared source of inspiration in the studio.

There is another type of comparison featured in the prototype – one which during development we likened to an assembly in a school playground – where your friends are gathered into different groups.

For example, this one looks at home ownership in England and Wales:

homes_home

Starting again from your twitter network…

homes_1

This visualisation starts to arrange your social network in groups…

homes_2

relating to the different experiences…

homes_3

homes_4

homes_5

and you can also rollover the individual avatars in this version, to see the individual’s experience…

homes_hilight

All the ‘dimensions’ in howmanyreally.com allow you to post what you’ve discovered to your social networks, if you want…

homes_post_to_twitter

There are a lot of influences on howmanyreally – both from the Eames, and in the case above – the work of Isotype, which I hope we’ll go into in a further post.

But for now let me encourage you to explore howmanyreally.com yourself. It’s little bit of a different animal from its sibling IMHO, which had such an immediate visual punch. This is a slower burn, but in my experience playing with it, I’ve found it can be just as powerful.

Both human history and current affairs unfortunately feature an high percentage of turmoil and tragedy.

While I’ve selected some rather neutral examples here, juxtaposing your friends with numbers of those injured, enslaved or killed through events in the past can really give one pause.

In its way, I’ve found howmanyreally.com a tool for reflection on history. A small piece that I can loosely join to a larger exploration of the facts. I really hope that’s your experience too.

If you don’t wish to use your social network accounts in connection with howmanyreally, you can enter a number you’re familiar with to centre the comparison on – for instance the size of a school class, or those in your office perhaps.

own_numbers

Or you can choose one of the comparisons we’ve prepared – for instance the number of people typically in a large cinema…

thing_numbers

As with howbigreally.com – if the prototype is successful, these new visualisations are designed to be incorporated as an element within the bbc.co.uk history and news sites. So do give your feedback to the BBC team through the contact details on the site.

It’s just left to me to say thanks to the team at the BBC who originally commissioned these explorations into history at human scale, including Lisa Sargood, Chris Sizemore, and Max Gadney.

Howmanyreally (and Dimensions as a whole) has been a fascinating and rewarding piece to work on, and thanks many members of the studio who have made it happen: Nick Ludlam, Simon Pearson, Matt Webb, Denise Wilton – and the core team behind its genesis, design and development: Alex Jarvis, James Darling, Peter Harmer and Tom Stuart.

Sensor-Vernacular

Consider this a little bit of a call-and-response to our friends through the plasterboard, specifically James’ excellent ‘moodboard for unknown products’ on the RIG-blog (although I’m not sure I could ever get ‘frustrated with the NASA extropianism space-future’).

There are some lovely images there – I’m a sucker for the computer-vision dazzle pattern as referenced in William Gibson’s ‘Zero History’ as the ‘world’s ugliest t-shirt‘.

The splinter-camo planes are incredible. I think this is my favourite that James picked out though…

Although – to me – it’s a little bit 80’s-Elton-John-video-seen-through-the-eyes-of-a-‘Cheekbone‘-stylist-too-young to-have-lived-through-certain-horrors.

I guess – like NASA imagery – it doesn’t acquire that whiff-of-nostalgia-for-a-lost-future if you don’t remember it from the first time round. For a while, anyway.

Anyway. We’ll come back to that.

The main thing, is that James’ writing galvanised me to expand upon a scrawl I made during an all-day crit with the RCA Design Interactions course back in February.

‘Sensor-Vernacular’ is a current placeholder/bucket I’ve been scrawling for a few things.

The work that Emily Hayes, Veronica Ranner and Marguerite Humeau in RCA DI Year 2 presented all had a touch of ‘sensor-vernacular’. It’s an aesthetic born of the grain of seeing/computation.

Of computer-vision, of 3d-printing; of optimised, algorithmic sensor sweeps and compression artefacts.

Of LIDAR and laser-speckle.

Of the gaze of another nature on ours.

There’s something in the kinect-hacked photography of NYC’s subways that we’ve linked to here before, that smacks of the viewpoint of that other next nature, the robot-readable world.


Photo credit: obvious_jim

The fascination we have with how bees see flowers, revealing animal link between senses and motives. That our environment is shared with things that see with motives we have intentionally or unintentionally programmed them with.

As Kevin Slavin puts it – the things we have written that we can no longer read.

Nick’s being playing this week with http://code.google.com/p/structured-light/, and made this quick (like, in a spare minute he had) sketch of me…

The technique has been used for some pretty lovely pieces, such as this music video for Broken Social Scene.

In particular, for me, there is something in the loop of 3d-scanning to 3d-printing to 3d-scanning to 3d-printing which fascinates.

Rapid Form by Flora Parrot

It’s the lossy-ness that reveals the grain of the material and process. A photocopy of a photocopy of a fax. But atoms. Like the 80’s fanzines, or old Wonder Stuff 7″ single cover art. Or Vaughn Oliver, David Carson.

It is – perhaps – at once a fascination with the raw possibility of a technology, and – a disinterest, in a way, of anything but the qualities of its output. Perhaps it happens when new technology becomes cheap and mundane enough to experiment with, and break – when it becomes semi-domesticated but still a little significantly-other.

When it becomes a working material not a technology.

We can look back to the 80s, again, for an early digital-analogue: what one might term ‘Video-Vernacular’.

Talking Heads’ cover art for their album “Remain In Light” remains a favourite. It’s video grain / raw quantel as aesthetic has a heck of a punch still.

I found this fascinating from it’s wikipedia entry:

“The cover art was conceived by Weymouth and Frantz with the help of Massachusetts Institute of Technology Professor Walter Bender and his MIT Media Lab team.

Weymouth attended MIT regularly during the summer of 1980 and worked with Bender’s assistant, Scott Fisher, on the computer renditions of the ideas. The process was tortuous because computer power was limited in the early 1980s and the mainframe alone took up several rooms. Weymouth and Fisher shared a passion for masks and used the concept to experiment with the portraits. The faces were blotted out with blocks of red colour.

The final mass-produced version of Remain in Light boasted one of the first computer-designed record jackets in the history of music.”

Growing up in the 1980s, my life was saturated by Quantel.

Quantel were the company in the UK most associated with computer graphics and video effects. And even though their machines were absurdly expensive, even in the few years since Weymouth and Fisher harnessed a room full of computing to make an album cover, moore’s law meant that a quantel box was about the size of a fridge as I remember.

Their brand name comes from ‘Quantized Television’.

Awesome.

As a kid I wanted nothing more than to play with a Quantel machine.

Every so often there would be a ‘behind-the-scenes’ feature on how telly was made, and I wanted to be the person in the dark illuminated by screens changing what people saw. Quantizing television and changing it before it arrived in people homes. Photocopying the photocopy.

Alongside that, one started to see BBC Model B graphics overlaid on video and TV. This was a machine we had in school, and even some of my posher friends had at home! It was a video-vernacular emerging from the balance point between new/novel/cheap/breakable/technology/fashion.

Kinects and Makerbots are there now. Sensor-vernacular is in the hands of fashion and technology now.

In some of the other examples James cites, one might even see ‘Sensor-Deco’ arriving…

Lo-Rez Shoe by United Nude

James certainly has an eye for it. I’m going to enjoy following his exploration of it. I hope he writes more about it, the deeper structure of it. He’ll probably do better than I am.

Maybe my response to it is in some ways as nostalgic as my response to NASA imagery.

Maybe it’s the hauntology of moments in the 80s when the domestication of video, computing and business machinery made things new, cheap and bright to me.

But for now, let me finish with this.

There’s both a nowness and nextness to Sensor-Vernacular.

I think my attraction to it – what ever it is – is that these signals are hints that the hangover of 10 years of ‘war-on-terror’ funding into defense and surveillance technology (where after all the advances in computer vision and relative-cheapness of devices like the Kinect came from) might get turned into an exuberant party.

Dancing in front of the eye of a retired-surveillance machine, scanning and printing and mixing and changing. Fashion from fear. Quantizing and surprising. Imperfections and mutations amplifying through it.

Beyonce’s bright-green chromakey socks might be the first, positive step into the real aesthetic of the early 21st century, out of the shadows of how it begun.

Let’s hope so.

Making Future Magic: light painting with the iPad

“Making Future Magic” is the goal of Dentsu London, the creative communications agency. We made this film with them to explore this statement.

(Click through to Vimeo to watch in HD!)

We’re working with Beeker Northam at Dentsu, using their strategy to explore how the media landscape is changing. From Beeker’s correspondence with us during development:

“…what might a magical version of the future of media look like?”

and

…we [Dentsu] are interested in the future, but not so much in science fiction – more in possible or invisible magic

We have chosen to interpret that brief by exploring how surfaces and screens look and work in the world. We’re finding playful uses for the increasingly ubiquitous ‘glowing rectangles’ that inhabit the world.

iPad light painting with painter

This film is a literal, aesthetic interpretation of those ideas. We like typography in the world, we like inventing new techniques for making media, we want to explore characters and movement, we like light painting, we like photography and cinematography as methods to explore and represent the physical world of stuff.

We made this film with the brilliant Timo Arnall (who we’ve worked with extensively on the Touch project) and videographer extraordinaire Campbell Orme. Our very own Matt Brown composed the music.

Light painting meets stop-motion

We developed a specific photographic technique for this film. Through long exposures we record an iPad moving through space to make three-dimensional forms in light.

First we create software models of three-dimensional typography, objects and animations. We render cross sections of these models, like a virtual CAT scan, making a series of outlines of slices of each form. We play these back on the surface of the iPad as movies, and drag the iPad through the air to extrude shapes captured in long exposure photographs. Each 3D form is itself a single frame of a 3D animation, so each long exposure still is only a single image in a composite stop frame animation.

Each frame is a long exposure photograph of 3-6 seconds. 5,500 photographs were taken. Only half of these were used for the animations seen in the final edit of the film.

There are lots of photographic experiments and stills in the Flickr stream.

Future reflection

light painting the city with Matt Jones

The light appears to boil since there are small deviations in the path of the iPad between shots. In some shots the light shapes appear suspended in a kind of aerogel. This is produced by the black areas of the iPad screen which aren’t entirely dark, and affected by the balance between exposure, the speed of the movies and screen angle.

We’ve compiled the best stills from the film into a print-on-demand Making Future Magic book which you can buy for £32.95/$59.20. (Or get the softcover for £24.95/$44.20.)

Friday links: drawing with light, AR in the Alps, and making music

Some links from around the studio for a Friday afternoon. Firstly, a video:

Graffiti Analysis 2.0: Digital Blackbook from Evan Roth on Vimeo.

Evan Roth’s “Graffiti Analysis 2.0″. Roth is trying to build a “digital blackbook” to capture graffiti tags in code. He’s started with an ingenious – and straightforward – setup for motion capturing tags: a torch taped to a pen, the motion of which is tracked by a webcam. The data is all recorded in an XML dialect that Roth designed – the Graffiti Markup Language – which captures not only strokes but also rates of flow, the location of the tag, and even the orientation of the drawing tool at start; clearly, it’s designed with future developments – a motion-sensing spraycan, perhaps – in mind.

But that’s all by the by: I liked the video because it was simple, ingenious, and Roth’s rendering of the motion data – mapping time to a Z-axis, dousing the act of tagging in particle effects – is really quite beautiful.

kalaam-530.jpg

Image: Poésie by kaalam on Flickr

I showed it to Matt W, and he showed me the light paintings of Julien Breton, aka Kaalam (whose own site is here). Breton’s work is influenced by Arabic script and designs, and the precision involved is remarkable – so often light-painting is vague or messy, but there’s a remarkable cleanliness and precision to Breton’s work. Also, as the image above demonstrates, he makes excellent use of both depth and the environment he “paints” within. If you’re interested, there’s a great interview with Breton here.

Image: Mont Blanc with “Peaks” by Nick Ludlum on Flickr

Nick’s off skiing this week, but he posted this screengrab from his iPhone to Flickr, and it’s a really effective implementation of AR. It’s an app called Peaks that simply displays labels above visible mountain-tops. It’s a great implementation because the objects being augmented are so big, and so far away, that the jittery display you so often get from little objects, nearby, just isn’t a problem. A handful of peaks, neatly labelled, and not a ropey marker in site.

And finally: Matt B’s Otamatone arrived. It’s delightful. A musical toy that sounds and works much like a Stylophone: you press a contact-sensitive strip that maps to pitch, but it’s the rubber mouth of the character – that adds filtering and volume just like opening and closing your own mouth – that brings the whole thing to life. You can’t see someone playing with it and not laugh!

It’s a product by Maywa Denki, an artist makes musical toys and sells them as products; previous musical toys include the Knockman Family, all of which are worth your time watching as much of you can on Youtube.

And if you get your own Otamatone, and practice really hard, maybe you could play with some friends:

1 in 3 schools are what? A story of what statistics can tell us

In the UK, schools are inspected every few years to make sure they’re educating kids well and run effectively.

Ofsted, the agency that visits the schools and writes the inspection reports, yesterday released their 2008/09 Annual Report. It’s a 160 page beast of stats, strengths and weaknesses, everything schools and the government need to focus their congratulations and new efforts. There’s a short commentary at the beginning which is great, but on the whole it has quite a lot of technical language.

The Daily Mail covered the report with a shocking headline, How 1 in 3 schools fail to provide adequate teaching. Gosh.

We decided to have a basic poke at the numbers ourselves, since we’ve just started working on Ashdown and have them all handy. (Ashdown is our name for a suite of beautiful and useful products we’re making for parents and teachers around UK schools data.)

So let’s have a look.

It’s pupils that matter to parents, so let’s look at 9- and 14-year-olds.

There are some 160,000 9-year-olds at schools in England that have been inspected in the last year (between September 2008 and August 2009). And about 161,000 14-year-olds, if you care about secondary schools. Let’s see how they break down…

9+14-year-olds at recently inspected schools in England

Pupils at schools recently graded by Ofsted in England

Happy schools are better schools.

A shade off two-thirds of all 9-year-olds and all 14-year-olds go to schools that are good or outstanding. But how about that Daily Mail headline? What does “not adequate” mean?

To find out about that I should say something about how Ofsted gives grades to schools. This is the terminology bit.

Oftsed grades

Ofsted do a few types of inspection, one of which is called a “Section 5 Inspection.” At the top of a report (here’s an example, taken totally at random) there’s a line called “Overall effectiveness of the school.” Right by it is a grade… 1 and 2 are outstanding and good respectively. There are also grades 3 and 4.

Grade 3 is “satisfactory.” You can read how Ofsted inspectors evaluate schools. It’s a bit dry, but in a nutshell a grade of ‘satisfactory’ means this: there’s nothing wrong with student performance, school leadership, value for money, or possibilities for improvement. Ofsted promise to inspect the school again within 3 years, and will make an interim visit just about half the time.

“Inadequate,” grade 4, means something is wrong with either how the kids are being educated, or the ability of the teachers to lead and improve the school. It’s pretty harsh.

1 in 3 schools are what?

Looking at our numbers, one in three pupils go to schools that are satisfactory or inadequate. Hang on, the headline said “fail to provide adequate teaching.” But only one in twenty pupils go to “inadequate” schools. Nineteen out of twenty go to schools that are satisfactory or better.

My confusion, I guess, arises because the headline uses a word which is very close to Ofcom’s own terminology – “inadequate” (grade 4) and “adequate” (in the headline, unused by Ofsted) – and so becomes ambiguous. That’s a shame. Is satisfactory adequate or not? I have no idea. How much do we care? The ambiguity obscures these discussions, but it’s great that journalism is provoking them. It’s huge, the difference in the numbers, between “satisfactory” being a grade we celebrate or one we don’t tolerate.

It’s also worth thinking about the purpose of these kind of statistics. What are stats for?

Let’s revisit Ofsted inspections. If you look again at a report (here’s another random example) and scroll riiight to the bottom, you’ll get a letter from the inspectors themselves written to the pupils of the school. In it the inspectors outline the strengths and weaknesses of the school, and what the school (and the pupils) need to do to improve. And that’s the whole point. It reinforces what’s good, and points out where effort is needed.

The Annual Report does a similar job. It’s a summary view to help focus the congratulations and efforts of parents, teachers and government bodies. Is it great or a concern that 19 out of 20 pupils go to schools that are satisfactory or better? Should we say only 19 out of 20?

In short: is “satisfactory” good enough? These numbers don’t tell us. That’s a matter for public debate.

A new kind of journalism

Holding that the job of statistics is to help target effort, we can go a little further.

We made another chart, for pupils at the “most deprived” schools, and how those schools are doing. Ofsted define the “most deprived” schools as the 20% of schools with the highest proportion of free school meals, so we did the same. (That means we’re looking at inspected schools in England that offer free school meals to 26% of their pupils or more.)

9+14-year-olds-02a

Pupils at “most deprived” schools recently graded by Ofsted in England

A couple of things to note here… the first is that we’re dealing with 37,000 9-year-olds and 23,000 14-year-olds. That’s a lot of kids. The second is that the general shape of the graph has changed. There are, proportionately, more inadequate schools.

And that’s an interesting story: if you’re a pupil aged 9 or 14, anywhere in England, we’ve seen you have about 1 in 20 chance of being at inadequate school. But if you go to one of the most deprived schools, that’s more like 1 in 13.

Now that sucks. Should we really allow there to be more inadequate schools in the most deprived areas? Shouldn’t those schools, in fact, be so well funded that they’re better than schools in general? Well, that priorities decision is a matter for our democratic system, and these are the kind of numbers journalism can provide to inform that debate.

Reports and reporting

What Ofsted’s Annual Report shows is that most pupils – a very large majority – go to schools that are satisfactory, good, or outstanding. But that pupils who go to the most deprived schools aren’t quite as lucky. I still don’t know what the difference is really like, on the ground, between a “satisfactory” and a “good” school, but I’ll reveal my personal politics: I’m glad I now have an opinion where the government should be targeting my tax money, and, from the inspection evaluation notes, I think that the report shows that generally schools are doing a great job.

There are a hundred stories like this in the data. It’ll take a bunch of hard graft and some clever maths to find the really surprising stories (that’s part of what we’re up to). But it’s all there. Actually it’s mostly all there in Ofsted Annual Report too, but percentages are hard to read and so another big part of Ashdown’s job is to add friendly meaning and understanding. That is, to point out which of these hundreds of numbers are important, from the perspective of pupils, parents and teachers.

Thanks Tom for a whole load of number crunching very early in the project, and thanks Matt Brown for whipping up these graphs!

Now back to your regularly scheduled programming…

Humanising data: introducing “Chernoff Schools” for Ashdown

“Hello Little Fella” is a group I started on Flickr a few years ago, spotting faces.

For a little while I had been taking pictures of objects, furniture, buildings and other things in my environment where I recognised, however abstract, a face.

I tagged them with what I thought the appropriate greeting – “hello little fella!”  – and soon it caught on with a few friends too.

Currently there are over 500 pictures from 129 people in there.

This is not an original thought – there are many other groups such as the far-more-successful “Faces In Places” – which has over 14000 pictures and almost 4000 members.

Why is it so popular?

Why do we love recognising faces everywhere?

In part, it’s due to a phenomenon called “Pareidolia”

“[a] psychological phenomenon involving a vague and random stimulus (often an image or sound) being perceived as significant. Common examples include seeing images of animals or faces in clouds, the man in the moon, and hearing hidden messages on records played in reverse.”

Researchers, using techniques such as magnetoencephalography (!) have discovered that a part of our brains – the Fusiform Face Area – makes sure anything that resembles a face hits us before anything else…

Here comes the science bit – from Early (M170) activation of face-specific cortex by face-like objects. by Hadjikhani, Kveraga, Naik, and Ahlfors:

“The tendency to perceive faces in random patterns exhibiting configural properties of faces is an example of pareidolia. Perception of ‘real’ faces has been associated with a cortical response signal arising at approximately 170 ms after stimulus onset, but what happens when nonface objects are perceived as faces? Using magnetoencephalography, we found that objects incidentally perceived as faces evoked an early (165 ms) activation in the ventral fusiform cortex, at a time and location similar to that evoked by faces, whereas common objects did not evoke such activation. An earlier peak at 130 ms was also seen for images of real faces only. Our findings suggest that face perception evoked by face-like objects is a relatively early process, and not a late reinterpretation cognitive phenomenon.”

So, all-in-all humans are very adept at seeing other human faces then – even if they are described in abstract, or not even human.

How might we harness this ability to help humanise the complex streams of data we encounter every day?

One visualisation technique that attempts to do just that is the “Chernoff Face”

Hermann Chernoff first published this technique in 1972 (the year I was born).

Matt’s Webb’s mentioned these before in his talk, ‘Scope’, and I think I first became aware of the technique when I was at Sapient around ten years ago. Poking into it at that time I found the investigations of Steve Champeon from 1995 or so into using a Java applet to create Chernoff faces.

There’s interesting criticism of the technique, but I’ve been waiting for the right project to try it on for about a decade now – and it looks like Ashdown just might be the one.

Ashdown is our codename for a suite of products and services around UK schools data. We’re trying to make them as beautiful and useful as possible for parents, teachers and anyone else who’s interested. There’s more on Ashdown here.

Over the last couple of weeks, the service design of the ‘alpha’ has started to take shape – and we’ve been joined by Matthew Irvine Brown who is art-directing and designing it.

In one of our brainstorms, where we were discussing ways to visualise a school’s performance – Webb blurted “Chernoff Schools!!!” – and we all looked at each other with a grin.

Chernoff Schools!!! Awesome.

Matt Brown immediately started producing some really lovely sketches based on the rough concept…

drawing_2009-11-16 0.jpeg

And imagining how an array of schools with different performance attributes might look like…

drawing_2009-11-16 1.jpeg

Whether they could appear in isometric 3D on maps or other contexts…

drawing_2009-11-20

And how they might be practically used in some kind of comparison table…

chernoff-schools-nearby_500w

Since then Tom and Matt Brown have been playing with the data set and some elementary processing code – to give the us the first interactive, data-driven sketches of Chernoff Schools.

It’s still early days – but I think that the Chernoff Schools are an important step in Ashdown finding its character and positioning – in the same way as the city-colours and ‘sparklogos’ we came up with early on in Dopplr’s life were.

It’s as much a logo, a mascot and an endearing, ownable emblem as it is a useful visualisation.

I can’t wait to see how the team develops it over the coming months.

Monday Links: Visualising memory, books, and the sky at night

Matt mentioned we haven’t had many pictures on the blog recently, so it’s about time I rectified that.

Choose Your Own Adventure

It’s been linked all over the web, but it’s still very much worth pointing out this lovely essay and series of visualisations of Choose Your Own Adventure books. Beyond the obvious prettiness of it, it’s a shrewd piece of work – I particularly enjoyed the insight into the changing editorial trends of the books, obtained simply from the visualisation work. Don’t forget to check out the “animations” and “gallery” at the top of the page – the animated versions of some of the graphics are particularly attractive. A really vivid example of the way visualisation work can be both useful and informative as well as beautiful.

Chumby One

Chumby have launched the Chumby One, a new version of their internet-connected device that can play Flash applications. The Chumby was always a hard product to explain – reliant on applications being installed into it, a squishy and unusual form factor, a quite high price tag. I’m really loving the design of the One, though: it’s much more straightforward and makes its intended usage (a kind of bedside/tabletop connected screen) much clearer. The inclusion of an FM radio helps put it into the bedside category, too. Still, there’s something about its new form factor (well illustrated in this Engadget review that is in many ways more endearing – simple because of its readibility – than the original, squishy box.

The most interesting point – for me, anyhow – is the pricecut. At nearly half the price – $119 compared to $199 – of the original Chumby, it becomes a much more attractive proposition, especially if you’re not entirely sure what you’d do with it. Not only cheaper, then, but also improved. It’s interesting to see a product slowly defining its edges over time.

Bear with me, but I think this is beautiful. It’s ICU64, a real-time debugger for Commodore 64 emulators. On the right in the video is the emulator; on the left is ICU64, displaying the memory registers of the virtual C64. To begin with, you can see the registers being filled and decompressed to in real time; then, you can see the ripple as all the registers empty and are refilled. And then, as the game in question loads, you can see registers being read directly corresponding to sprite animation. What from a distance appears to be green and yellow dots can be zoomed right into – the individual values of each register being made clear. It’s a long video, but the first minute or two makes the part I liked clear: a useful (and surprisingly beautiful) visualisation of computer memory. It helps that the computer in question has a memory small enough that it can reasonably be displayed on a modern screen.

Zeiss Star Projector

Over at BLDGBLOG, Geoff Manaugh ruminates about putting a planetarium projector onto the fourth plinth in Trafalgar Square:

A rain-proof planetarium machine could be installed in public, anchored to the plinth indefinitely. Lurking over the square with its strange insectile geometries, the high-tech projector would rotate, dip, light up, and turn its bowed head to shine the lights of stars onto overcast skies above. Tourists in Covent Garden see Orion’s Belt on the all-enveloping stratus clouds—even a family out in Surrey spies a veil of illuminated nebulae in the sky.

The Milky Way rolls over Downing Street. Videos explaining starbirth color the air above Pall Mall and St. Martin in the Fields goes quiet as ringed orbits of planets are diagrammed in space half a mile above its steeple.

The Zeiss Star Projector Manaugh illustrates his article with is a beautiful object (see above), and it’s the best I can do to illustrate this link; the idea has a few implementation details, you might say, but there’s an undeniable poetry in it, and that idea feels like a very beautiful picture to end on.

Maps as service design: The Incidental

Schulze & Webb worked as part of the team producing a unique service for the world’s biggest furniture and design event: Salone del Mobile in Milan, this year.

The British Council usually maintains a presence there, promoting British design and designers through an exhibition. This year, they had decided they would rather present some kind of service offering rather than a physical exhibition in a single venue.

Daniel Charny, of Fromnowon contacted us early on in the project, when they were moving the traditional thinking of staging an exhibition of to something that was more alive, distributed and connected to the people visiting Salone from Britain whilst also connecting those around the world who couldn’t be there.

From the early brainstorms we came up with idea of a system for collecting the thoughts, recommendations, pirate maps and sketches of the attendees to republish and redistribute the next day in a printed, pocketable pamphlet, which, would build up over the four days of the event to be a unique palimpsest of the place and people’s interactions with it, in it.

Åbäke, a collective of graphic designers who came up with the look and identity of the finished publication, alongside a team from the British Council ventured out to Milan to establish a temporary production studio for The Incidental, while S&W provided remote support from the UK, and the technology to harvest the twitter posts, blog mentions and flickr photos to be included in the edition, overlaid on the map to be produced overnight.

One thing that’s very interesting to us that is using this rapidly-produced thing then becomes a ’social object’: creating conversations, collecting scribbles, instigating adventures – which then get collected and redistributed.

As author/seer Warren Ellis points out, paper is ideal material for this:

“…cheap. Portable. Biodegradable/timebound/already rotting. Suggestion of a v0.9 object. More likely to be on a desk or in a pocket or bag or on a pub table than to be shelved. More likely to be passed around.”

The Incidental is feedback loop made out of paper and human interactions –  timebound, situated and circulating in a place.

Here’s the first edition from the Wednesday of the event:

There’s some initial recommendations from the British Council team and friends, but the underlying abstracted map of Milan remains fairly unmolested.

Compare that to the last edition on Saturday, where the buzz of the event has folded back into the artifact:

blog-pic-2

The map now becomes something less functional – which it can probably afford, as you the visitor have internalised it – and becomes something more emotional or behavioural: a heat-map-like visualisation of where’s hot and what’s happened.

The buzz about TheIncidental during the event was clear from the twitterfeed, which itself was feeding the production.

We were clearly riffing on the work done by our friends at the RIG with their “Things our friends have written on the internet” and the thoughts of Chris Heathcote, Aaron and others who participated in Papercamp back in January.

Since then there’s been a flurry of paper/map/internet activity, including the release recently of the marvellous Walking-Papers project by Mike Migurski of the mighty Stamen, which we talked about briefly in The New Negroponte Switch.

As well as coverage from more design-oriented blogs such as PSFK and Dezeen, there was also some encouraging commentary from our peers – many of whom saw this as the first post-Papercamp project.

Ben Terrett of the RIG said:

“Over in Milan at the Salone di Mobile they’ve created a thing called The Incidental. It’s like a guide to the event but it’s user generated and a new one is printed every day. When I say user generated, I mean that literally. People grab the current day’s copy and scribble on it. So they annotate the map with their personal notes and recommendations. Each day the team collect the scribbled on ones, scan them in and print an amalgamated version out again. You have to see it, to get it. But it’s great to see someone doing something exciting with ‘almost instant’ printing and for a real event and a real client too.

The actual paper is beautiful and very exciting. It has a fabulous energy that has successfully migrated from the making of the thing to the actual thing. Which is also brilliant and rare.”

To quote the patron saint of S&W again, Warren Ellis said:

“This is a wonderful idea that could be transposed to other events.”

Aaron Straup-Cope of Flickr, and author of many thoughts on what he calls the Papernet said:

“they are both lovely manifestations of Rick Prelinger’s “abundant present” and a well-crafted history box, something that people can linger over and touch and share, for the shape of the event.”

Our neighbours in East London, and brand identity consultants Moving Brands said:

“What a great way to create international conversation and connecting the tangible with the digital.”

Russell Davies said:

“I love the way it gets past digital infatuation and analogue nostalgia. Digital stuff is used for what it’s good for; eradicating time and distance, sharing, all that. Analogue stuff is used for what it can do well; resilience, undestandability, encouraging simple, human contributions. It’s properly ‘post digital’, from a design team and a client who are fluent in the full range of media possibilities. Not just digital, not just print. It integrates media in the same way real people do; knowing what it’s like to send a twitter and knowing what it’s like to scribble a note on a beermat at 3 in the morning.”

All credit to the team who were in Milan. They worked some punishing hours producing the paper each day, partly due to the demanding nature of the event itself and of course the demanding nature of trying something completely new. Huge and hearty congratulations to them for pulling it off.

As we didn’t attend Salone, it was only recently when we got together with the British Council team to discuss what worked and what didn’t that we saw the finished artifacts.

blog-pic-1

It was fantastic to see and touch them. In that moment, it became obvious that their dual-role was as both service and souvenir.

Recent Posts

Popular Tags