This website is now archived. To find out what BERG did next, go to www.bergcloud.com.

Blog posts tagged as 'web'

BBC Dimensions: integrating with BBC News

Back in 2009, we started the work that would become http://howbigreally.com and http://howmanyreally.com with the BBC, releasing those two prototypes over the last two years under the banner of “BBC Dimensions“.

Our intention from the beginning was to design the service as a module that could be integrated into bbc.co.uk at a later date if they proved successful with audiences.

Earlier this year, Alice worked with the engineers at BBC News to do just that, and now the first BBC News stories featuring the “How Big Really” module are starting to appear.

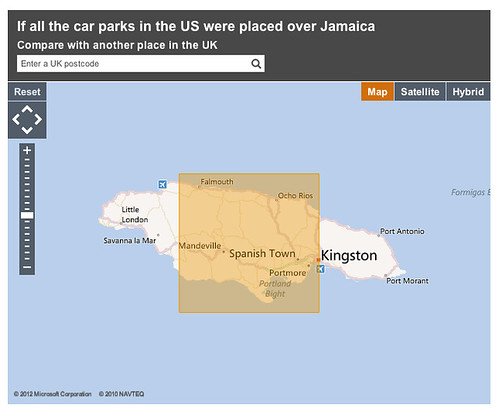
Here are a couple of examples – a story on the vast amount of space given over to car parking in the world, illustrated with the module juxtaposing the total space used by parked cars over the island of Jamaica!

http://howbigreally.com functionality integrated into BBC News

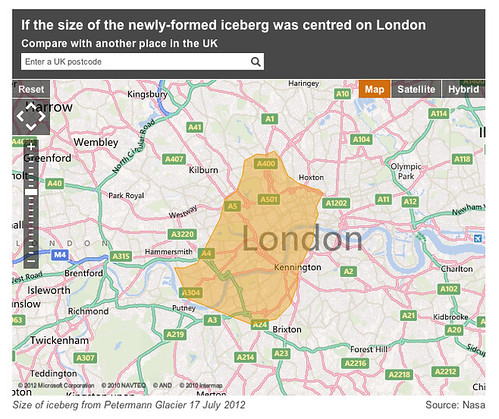
…and a more recent example showing the size of a vast iceberg that has just broken free of a glacier on Greenland.

http://howbigreally.com functionality integrated into BBC News

Of course, as with the original http://howbigreally.com prototype, you can customise the juxtaposition with the post-code of somewhere you’re familiar with – like your home, school or office.

The team worked hard to integrate the prototype’s technology with BBC News’s mapping systems and the the look/feel of the site overall.

Here’s Alice on some of the challenges:

We worked with the BBC Maps team to create a tool that could be used by editors, journalists and developers to create How Big Really style maps. Chris Henden and Takako Tucker from the team supplied me with the BBC Maps Toolkit and did a great job of explaining some of its more nuanced points, particularly when I got into trouble around Mapping Projections.

The tool takes an SVG representation of an area, including a scale element, converts it to a JSON object that is then rendered onto a map using the BBC Maps Toolkit. Immediate feedback allows the map creator to check their SVG is correct, and the JSON representation of the shape can then be used to build the map in future.

It’s really satisfying for us to see something that started as a conceptual prototype back in 2009 find it’s way into a daily media production system of the scale and reach of BBC News.

Thanks to all the team there – also Chris Sizemore, Lisa Sargood and Max Gadney for shepherding the project from whiteboard sketches to become part of the BBC journalist’s digital toolkit.

BBC Dimensions: How Many Really?

Update, February 2013: Howmanyreally.com has now finished its prototype trial, and is no longer live.


About two years ago, we started work with Max Gadney on a series of workshops looking at how digital media could be used for relating stories and facts from both history and current affairs.

One of the concepts was called ‘Dimensions’ – a set of tools that looked to juxtapose the size of things from history and the news with things you are familiar with – bringing them home to you.

About a year ago, we launched the first public prototype from that thinking, http://howbigreally.com, which overlaid the physical dimensions of news events such as the 2010 Pakistan Floods, or historic events such as the Apollo 11 moonwalks on where you lived or somewhere you were familiar with.

It was a simple idea that proved pretty effective, with over half-a-million visitors in the past year, and a place in the MoMA Talk To Me exhibition.

Today, we’re launching its sibling, howmanyreally.com

BBC Dimensions: How Many Really

You can probably guess what it does from the URL – it compares the numbers of people who experienced an event with a number you can relate to: the size of your social network.

For example, the number of people who worked at Bletchley Park cracking codes and ushering in the computer age…
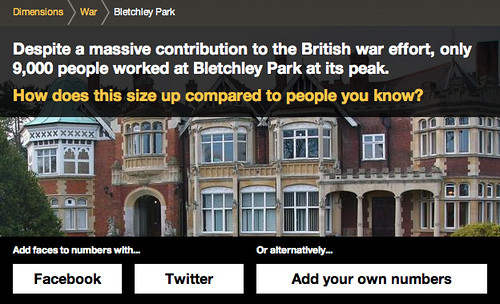
bletch_home

I can sign in with my Twitter account
bletch_1

and I’m placed at the centre…

bletch_2

Clicking to zoom out shows me in relation to those I follow on Twitter…
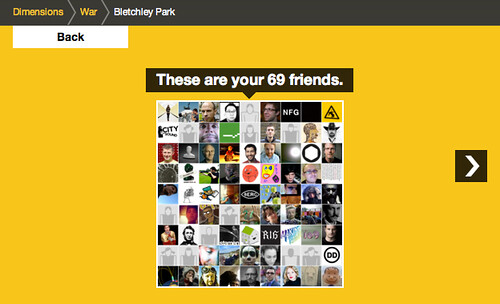
bletch_3

Zooming out again places that group in relation to those working at Bletchley Park in 1945.

bletch_4

Which, in turn, is then compared to the Normandy Landings
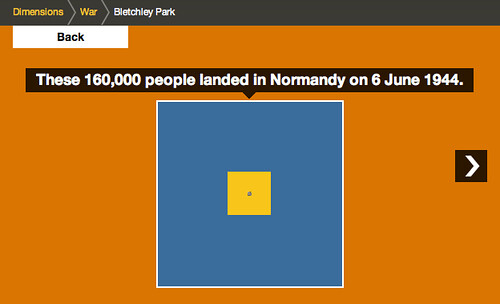
bletch_5

…and finally the 1.5m people in the Home Guard
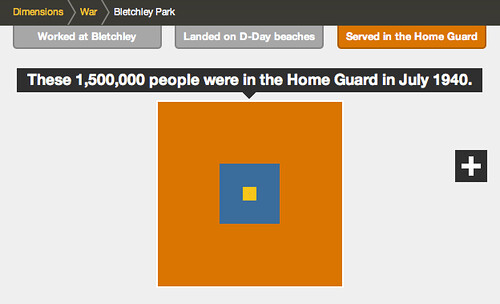
bletch_6

Despite the difference between the size of the final group and your social network, it can still just be made out at the centre of the diagram, helping us imagine the size of the group involved in these efforts during World War 2.

Of course this visualisation owes much to the pioneering work of the Office of Charles & Ray Eames – particularly their “Powers of 10” exploration of relative scale, which is a shared source of inspiration in the studio.

There is another type of comparison featured in the prototype – one which during development we likened to an assembly in a school playground – where your friends are gathered into different groups.

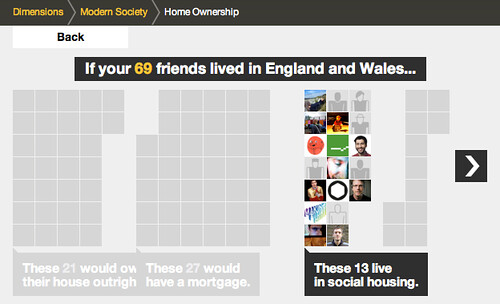
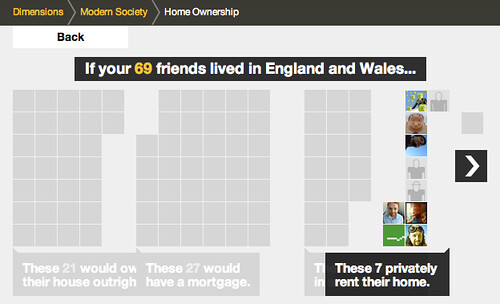
For example, this one looks at home ownership in England and Wales:

homes_home

Starting again from your twitter network…

homes_1

This visualisation starts to arrange your social network in groups…
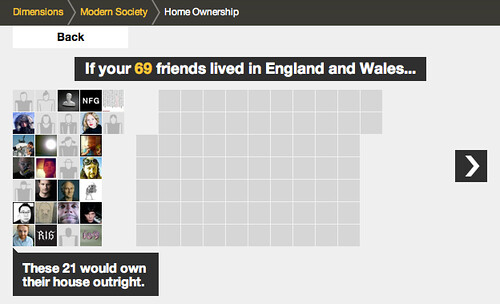
homes_2

relating to the different experiences…

homes_3

homes_4

homes_5

and you can also rollover the individual avatars in this version, to see the individual’s experience…
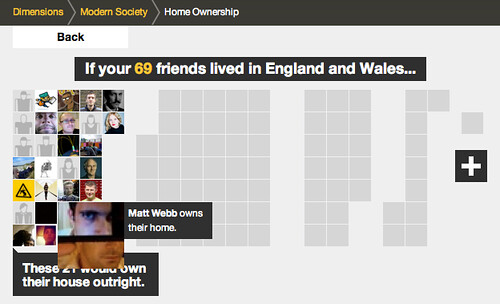
homes_hilight

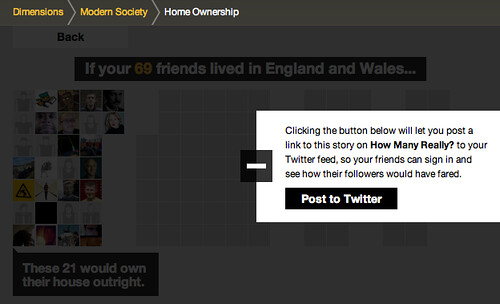
All the ‘dimensions’ in howmanyreally.com allow you to post what you’ve discovered to your social networks, if you want…
homes_post_to_twitter

There are a lot of influences on howmanyreally – both from the Eames, and in the case above – the work of Isotype, which I hope we’ll go into in a further post.

But for now let me encourage you to explore howmanyreally.com yourself. It’s little bit of a different animal from its sibling IMHO, which had such an immediate visual punch. This is a slower burn, but in my experience playing with it, I’ve found it can be just as powerful.

Both human history and current affairs unfortunately feature an high percentage of turmoil and tragedy.

While I’ve selected some rather neutral examples here, juxtaposing your friends with numbers of those injured, enslaved or killed through events in the past can really give one pause.

In its way, I’ve found howmanyreally.com a tool for reflection on history. A small piece that I can loosely join to a larger exploration of the facts. I really hope that’s your experience too.

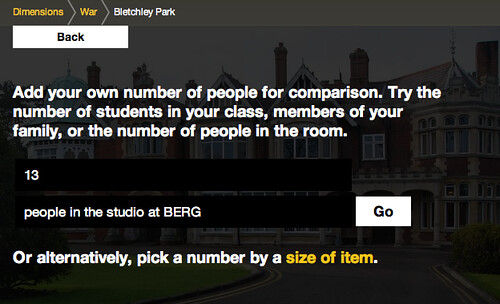
If you don’t wish to use your social network accounts in connection with howmanyreally, you can enter a number you’re familiar with to centre the comparison on – for instance the size of a school class, or those in your office perhaps.
own_numbers

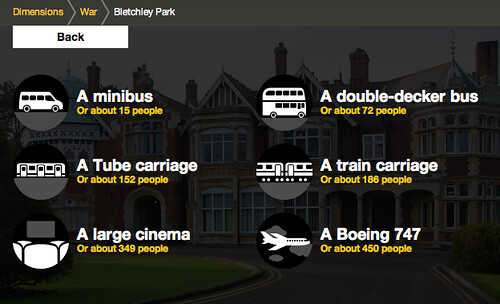
Or you can choose one of the comparisons we’ve prepared – for instance the number of people typically in a large cinema…
thing_numbers

As with howbigreally.com – if the prototype is successful, these new visualisations are designed to be incorporated as an element within the bbc.co.uk history and news sites. So do give your feedback to the BBC team through the contact details on the site.

It’s just left to me to say thanks to the team at the BBC who originally commissioned these explorations into history at human scale, including Lisa Sargood, Chris Sizemore, and Max Gadney.

Howmanyreally (and Dimensions as a whole) has been a fascinating and rewarding piece to work on, and thanks many members of the studio who have made it happen: Nick Ludlam, Simon Pearson, Matt Webb, Denise Wilton – and the core team behind its genesis, design and development: Alex Jarvis, James Darling, Peter Harmer and Tom Stuart.
Say hello to Schooloscope

Schooloscope is a new project from BERG, and I want to show it to you.

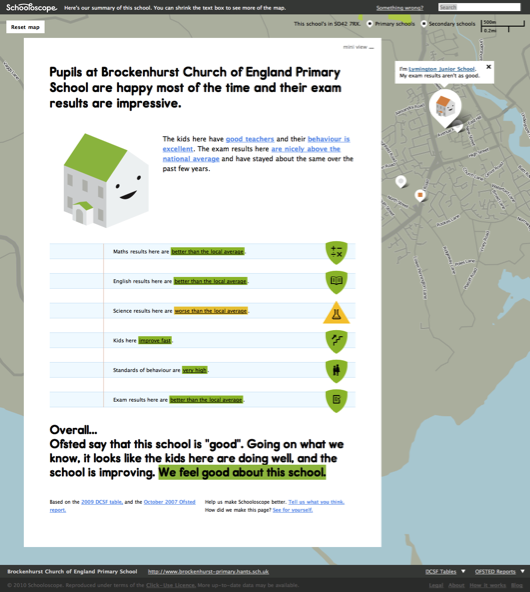
What if a school could speak to you, and tell you how it’s doing? “I have happy kids,” it might say. “Their exams results are great.”

Schools in England are inspected by a body called Ofsted. Their reports are detailed and fair — Ofsted is not run by the government of the day, but directly by Parliament. And kids in schools are tracked by the government department DCSF. They publish everything from exam results to statistical measurements of improvement over the school careers of the pupils.

Cooooomplicated.

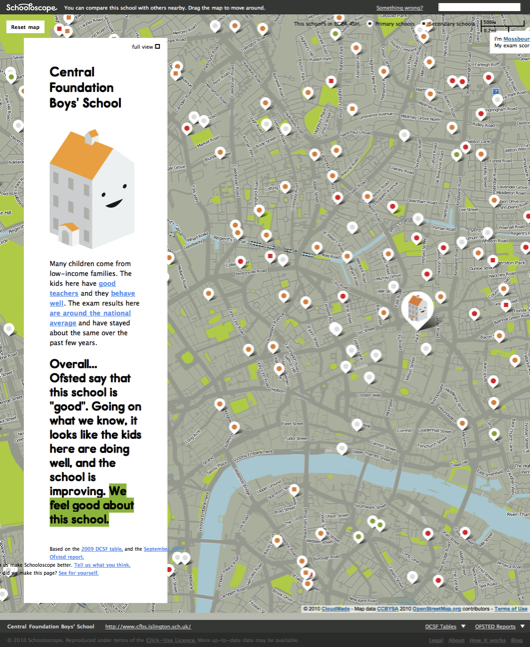
What Schooloscope does is tell you how your school’s doing at a glance.

There are pictures of smiling schools. Or unhappy ones, if the kids there aren’t happy.

Each school summarises the statistics in straightforward, natural English. There are well over 20,000 state schools in England that we do this for. We got a computer to do the work. A journalism robot.

You can click through and read the actual stats afterwards, if you want.

Why?

A little of my personal politics. Education is important. And every school is a community of teachers, kids, parents, governors and government. The most important thing in a community is to take part on an equal footing and with positive feeling. Parents have to feel engaged with the education of their children.

As great as the government data is, it can be arcane. It looks like homework. It’s full of jargon… and worse, words that look like English but that are also jargon.

Schooloscope attempts to bring simplicity, familiarity, and meaning to government education data, for every parent in England.

A tall order!

This is a work in progress. There are lots of obvious missing features. Like: finding schools should be easier! There are bugs. There’s a whole bunch we want to do with the site, some serious and some silly. And full disclosure here: over the next 6 months we’re working on developing and commercialising this. Schooloscope is a BERG project funded by 4iP, the Channel 4 innovation fund. Is it possible to make money by being happily hopeful about very serious things and visualising information with smiling faces? I reckon so.

Anyway. The way we learn more is by taking Schooloscope public, seeing what happens, and making stuff.

The team! Tom Armitage and Matt Brown have worked super hard and made a beautiful thing which is only at the start of its journey. They, Matt Jones and Kari Stewart are taking it into the future. Also Giles Turnbull, Georgina Voss, and Ben Griffiths have their fingerprints all over this. Tom Loosemore and Dan Heaf at 4iP, thanks! And everyone else who has given feedback along the way.

Right, that’s launch out of the way! Let’s get on with the job of making better schools and a better Schooloscope.

Say hello to Schooloscope now.

Shownar

Some weeks back, halfway through the development of Shownar, I saw a whole bunch of messages on Twitter about a mix on BBC Radio 1. That was the Jaguar Skills Gaming Weekend mix — it’s no longer on iPlayer, but that turned into an ace afternoon with ace music.

More recently the Reith Lectures have been on Radio 4. Shownar’s finding a load of blog posts about the lectures, really insightful ones. I didn’t realise the lectures were on until they popped up on the site one morning.

This is a website I now check daily…

Shownar

Shownar

Shownar tracks millions of blogs and Twitter plus other microblogging services, and finds people talking about BBC telly and radio. Then it datamines to see where the conversations are and what shows are surprisingly popular. You can explore the shows at Shownar itself. It’s an experimental prototype we’ve designed and built for the BBC over the last few months. We’ll learn a lot having it in the public eye, and I hope to see it as a key part of discovery and conversation scattered across BBC Online one day.

Dan Taylor tells the story on the BBC Internet blog, so I won’t say more here except for a few thanks…

Dan calls out our colleagues at the BBC. I’d like to thank especially him and Kat Sommers. Our data partners at Nielsen, Twingly and Yahoo!, as well at the LiveStats team inside the BBC — it’s been a pleasure to work with you. Major kudos to the folks behind the BBC Programmes database and system for creating such a fundamental piece of infrastructure. And to everyone working for and with S&W: Max Ackerman, Jesper Andersen, Nick Ludlam, Jack Schulze, and most especially Tom Armitage, Phil McCarthy and Phil Gyford, great work and well done all! I’m proud to work with all of you.

The idea of using computers to watch and reflect audiences, to find not just what’s popular but what’s surprisingly popular, turns out to be a number-crunchingly heavy task. I hope that Shownar, during this phase of its development, becomes a site people genuinely use daily to join in talking about and with the BBC, and to widen their consumption to previously undiscovered, engaging programmes. There’s a feedback address on the site — please use it! We’re after stories of where it works and where it doesn’t, and some insight into whether this kind of product really does change habits. It has mine.

We go public today: Shownar.

Hello vod:pod

vod:pod is the newest video sharing and aggregator site on the block, and it has a few twists. Three of them:

First, the primary focus is a video collection (a pod) rather than a single one. Collecting can be done by individuals or together. So, for example, here are 4 people collecting indie music. You can scrub over the videos for a rank and rating preview before watching, and the sparkline at the top right gives you an idea of the popularity of the pod.

Second, VodPod lets you upload videos but doesn’t ask for an exclusive relationship. It reaches out into the Web–you can include videos from YouTube, Google Video, and so on in your pod, and keep all of them collected alongside your own ones. These highlighted pods all mix-and-match from different service.

Last is something Mark Hall just told me about: Each video has a low-threshold response widget next to it, so you can say quickly that you loved, just watched, or laughed at what you saw. If you add your Twitter details in your vod:pod profile, that response will also be announced to your Twitter buddies. Simple, social and (importantly) deliberate every time.

There’s a lot more to come – really big features – but I’ll leave it there.

vod:pod is the first service I’ve watched all the way from early concept through to launch. S&W did some very early product ideation and experience work – on how people find videos to watch online, as Mark discusses – and I’ve been following progress since. While the shape of the solution has changed considerably, the core values have been maintained: Organising, socialising, and being part of the Web.

I find that promising, and so vod:pod‘s what we use to host videos for this blog.

Making Senses revisited

Adaptive Path kindly invited me to their offices this morning, where I muddled through my Making Senses talk, on using the human senses as inspiration for next-generation Web browser functionality.

Optic flow

Revisiting the slides, and the conversation afterward, has shown me how to state the argument more directly:

  1. As far as interaction on the computer desktop and the Web goes, navigational and spatial metaphors dominate. On a micro level we talk about direct manipulation of files via icons: Dragging, moving, opening and so on. On a macro level, we have addresses, visiting, and sitemaps.
  2. When a person has navigated to something, they can know what it is because of the navigation itself. For instance, you know you’re in London because you followed all the signposts to London.
  3. In a world of cheap sensors, many, many display surfaces, and high connectivity, we are presented with information without that navigational context. Furthermore, in areas which have traditionally used the navigational metaphor (mainly the Web), navigation might not be the most appropriate approach to reading the news, buying books, or hanging out in chatrooms. Yet still we approach Web design armed with this metaphor.
  4. It’s as important that a thing can be instantly appreciated for what it is, as that it can be navigated to. ‘Instantly appreciate’ means comprehend pre-consciously, just as we instantly appreciate a chair as a chair when looking at it, without having to deliberately deduce the meaning of the pattern of light on our retina.
  5. As a guide to what qualities we should be able to instantly appreciate, we can use human and animal senses to show what features we need to recognise of things in the environment. Sensing these features is sufficient to let us intelligently interact, without navigating.
  6. To summarise these features, we need to be able to detect: Structure, focus and periphery, rhythms of activity, summaries, how this particular thing is situated in the larger environment (and more). The Web browser, as our sensory organs online, should do this job, instead of leaving it to the websites themselves.

Applying the sensory model to Web design triggers a few ideas:

  • The high-level structure of all sites should be represented by the browser in a consistent way, not by each site differently.
  • Regular patterns in browsing (such as the sites visited daily or weekly) should be supported by the browser.
  • Using the extracted keywords of a web page as its ‘scent,’ hyperlinks should indicate how their odour strengthens or detracts from the smell of the current browsing trail.

There are more ideas, but that’s what the presentation discusses and illustrates.

Incidentally, the image at the top of this post is from J. J. Gibson’s The Ecological Approach to Visual Perception, which talks about how we see continuously and actively as we move through space. I’d like to consider browsing the Web in the same light.

XTech 2007, call for participation

XTech, the European web technologies conference, has picked The Ubiquitous Web as its 2007 theme:

As the web reaches further into our lives, we will consider the increasing ubiquity of connectivity, what it means for real world objects to be part of the web, and the increasing blurring of the lines between virtual worlds and our own.

The call for participation is now open; topics we find especially interesting are mobile devices, RFID, user interface, web apps, and of course where this is all going.

Alongside Adam Greenfield of Everyware and Gavin Starks of Global Cool, S&W will be keynoting. See you there!

Deploy to desktop

Web apps are currently undergoing a renaissance–or perhaps they’re fulfilling the promise made when the genre was created in 1999. The technology, skills and community that go to make these web apps is beginning to turn in many different directions. We’ll soon see a number of different web app species. One I find most exciting is Deploy to Desktop. What if the same skills needed to build complex web apps could be turned to making desktop applications, starting from a simple web app in a HTML renderer window, and iterating to use native widgets, drag and drop, and full OS integration? (More about this in my App After App talk.)

We’re on the way there. Three data-points for that journey:

Apollo is Adobe’s cross-platform runtime, based on Apple’s WekKit, that lets you run HTML/CSS/AJAX apps on the desktop. It works offline, includes an API for communication between Apollo apps, and will let you write database hooks to a local or remote persistent store. The Apollo wrapper will be distributed free, like Acrobat Reader or the Flash Player (personally I think this is the wrong model–apps should be standalone, but we’ll see). Some Apollo screenshots.

Next is WebKit on Rails which is exactly what I wanted to see when I gave that talk. It makes it easy (well, easier) to take your Ruby on Rails web app, wrap it in WebKit, the Mac HTML renderer, and run it as a desktop app. See the list of existing projects for applications you can already download.

Last up is Pyro, which wraps 37signal’s Campfire browser-based live chat application and turns it into a Mac app. Features include a badged application icon (the number of unread messages are shown), drag and drop upload, scripting support and more. Someday all web apps will be available this way.

From pagerank to pagefeel?

Back in June, at reboot8, I presented a series of web browser enhancement ideas based on an investigation of the human senses. (The slides and my notes are online: Making Senses.)

The concept of taste led me to imagine what it would be like to take a hyperlink on a webpage, and pop it in your mouth (taste starts on slide 7). Just like our tongue picks up a 4 or 5 flavours, but sometimes we really enjoy a salty or bitter taste and sometimes we don’t, what are the 4 or 5 tastes of a webpage that we like depending on our mood and nutritional requirements of the day?

Web page taste

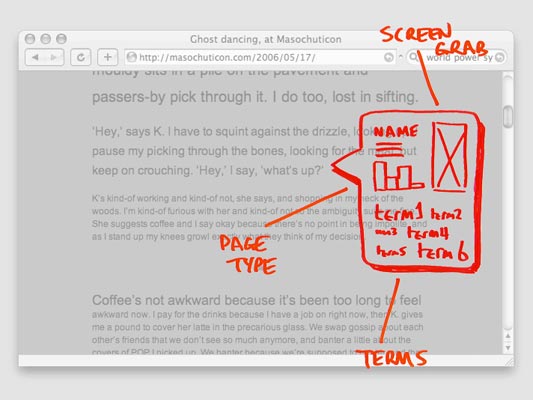
In my sketch, tasting a link involves hovering over it and having a flavour summary pop up. This includes a thumbnail of the page at the end of the hyperlink, it’s extracted terms (corresponding to the smell), and a bar chart of the 4 page tastes (flavour is a combination of all of these). The 4 I chose, with only a little thought, were:

  • Is it an outward-linking page, like a contents page, or an inwardly focused page like an essay?
  • Is it frequently updated?
  • Is the text more in the 3rd person, like a corporate or academic page, or more about the 1st person–subjective, like a blog or journal?
  • Do many people link to this page, ie what is its pagerank?

They’re okay, as tastes, I think, but really could be better.

Fast forward a few months…

At eurofoo06, Ben Gimpert presented on the “Theomatics of Food” (he has a culinary background). He spoke about mouthfeel, that sensory experience of taste, materiality, stickiness… it’s a grand word.

Where I really pricked my ears up was when Ben joined taste to mouthfeel. What is the feel, he asked, of the main tastes? He speculated:

  • “Sour” mouthfeel: pucker-y
  • “Salty” mouthfeel: chewy
  • “Bitter” mouthfeel: coating-y
  • “Sweet” mouthfeel: crunchy

(I don’t recall whether he mentioned umami/pungent or spicy in this section too.)

Now this I like. Given those 4 tastes, and their corresponding feelings, are what we need to make a first-pass judgement on whether we need the buckets of chemicals available in any given food… could I use these real tastes to make the equivalent 4 for webpages?

What does my browser-mouth taste when I click a link? What are the basic flavours of HTML? What is the pagefeel?

So I think I’ll revise my original 4 web tastes. They’ll still take a lot of datamining to calculate, but that’s fine. Perhaps crunchy pages are like popcorn, ones people stay on for not much time, but when they click away it tends to be on another, almost identical page. Coating-y pages are ones that linger… could these be social sites, where you get embroiled in the community, sticky sites?

Chewy sites are long and worthwhile: academic papers, pages that are knowledge hubs, using keywords from a lot of separate parts of the web. And I’m not sure what pucker-y/sour is. Sour makes me think of lemons, which makes me think of citric acid at the centre of the metabolic cycle, which tastes nasty but is at the middle of all life. Perhaps the equivalent for the web is hyperlinks. Pages with a lot of hyperlinks on them are the concentrated stuff of life on the web, and so they taste very, very sour.

Okay, enough of that silliness.

I still think it’s worth taking huge quantities of every metric we can gather about the web and web browsing behaviour – page linger time, click-away time, search terms, text reading age, word tense, link network position, everything – and datamining it as much as we can. Maybe out of all of that we’ll find some stable metrics for describing pages, possibly even those pagefeels, and those will be great additions to search engines and web browsers.

Alternative taste suggestions welcome!

Recent Posts

Popular Tags