This website is now archived. To find out what BERG did next, go to www.bergcloud.com.

Blog posts tagged as 'elements'

Infinite Zoom into Milk

In 1977 Charles and Ray Eames made a documentary film called Powers of Ten. The second half of the film includes a slow zoom into a man’s hand, right the way through cells and molecules all the way down to an atomic structure. It’s extraordinarily engaging, beginning at a familiar human context, and visualising something desperately distant and unknowable.

About a year ago James King brought a book to my attention from a series called Analysis of the Massproduct Design by Japanese product designer Taku Sato.

Analysis of the Massproduct Design is just like the Eames Powers of Ten video but for everyday products.

Taku Sato book covers

Each book takes a manufactured product and breaks down the content, graphics, construction and packaging page by page. The books are like infinite zooms into fabrication and history.

There are four, in turn looking at Xylitol Lime Mint chewing gum, a Fujifilm disposable camera, ‘Licca the fashion dress up doll by Takara Co.’ and a litre of milk from the Meiji Dairies Corporation. The blurb reads:

…we will take up and focus on one mass-produced product seen everywhere in our daily life without special attention paid to and from the point of view of design we try to take a closer look at and analytically examine it to find what kinds of ideas, efforts, ingenuities have been put in to it.

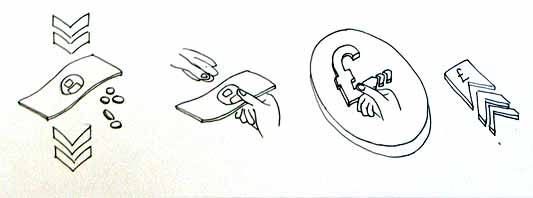
Each book begins with an overview and in some cases a history. This is from the book on the Fujifilm disposable camera.

Fujifilm overview

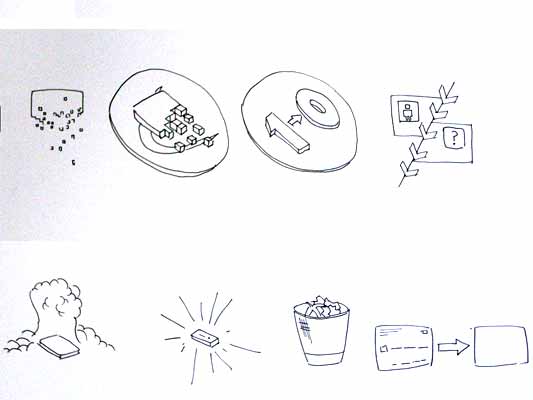
As the book progresses, spreads examine the product in greater and greater detail. Near the end of the Fujifilm book, there’s a photographic one micrometer cross section of the film stock.

fujifilm book film detail

One of my favourites spreads is from the book examining Xylitol chewing gum and is titled ‘The Feeling on the Teeth When Chewed.’ It’s about the material qualities of tablets versus sticks of gum. A quote:

The firmness of a chewing gum changes gradually with the passing of the time of its being chewed. In order to make this change of the chewing feeling close to an ideal one, the elements that should make up of the chewing gum are controlled… The figure shows the strength of the chewing exerted in the mouth measured with an analyzing device called RheoMeter. These graphs will tell you how different the chewing feelings are between ordinary sheet-type chewing gum and sugar coated chewing gum.

An ideal chewing feeling! A RheoMeter! They’ve got a machine for testing the chewiness of gum.

chewiness spread

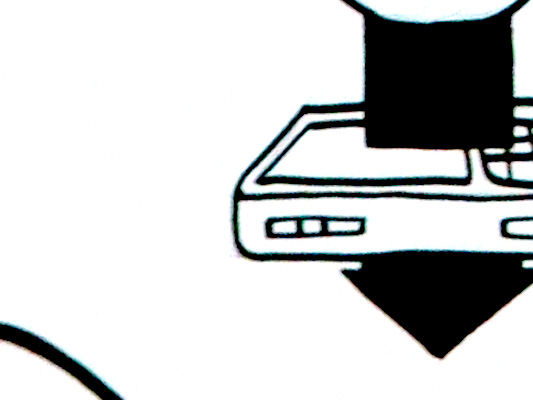
I think Taku Sato actually designed the packaging for the milk carton he analyses. One of the spreads shows what each of the indents on the base of the cartons are for. Ambiguity in the translation adds to the mystery in some cases:

…(image a) is a little dented. This is for securing the stability of the carton when placed straight on a table… The number (image c) is the filling machine’s column index. The embossed information works for cause of the trouble to be clarified when it happens.

Taku Sato milk base

The books feel like imaginary manuals. They offer the seductive illusion that with this book the object can be completely known, all secrets unravelled. They somehow imply that if all was lost, objects like these could be reconstructed with this knowledge alone.

A while back I came across the term ‘Spime’ in Bruce Sterling‘s book Shaping Things. He uses the word to characterise smart objects which talk about their histories, how they were made, where they were sourced, where they’ve been, etc. Spimes might be a cars which announce their locations, or a packaged beef steak which shows the cow it comes from and where that cow was raised.

Sato’s books are raw Spime porn. Objects showing off their shiny interiors, construction and their ancestors. The celebrity biographies of mass produced objects.

RFID Interim update

Last term during an interim crit, I saw the work my students had produced on the RFID icons brief I set some weeks ago. It was a good afternoon and we were lucky enough to have Timo Arnall from the Touch project and Younghee Jung from Nokia Japan join us and contribute to the discussion. All the students attending showed good work of a high standard, overall it was very rewarding.

I’ll write a more detailed discussion on the results of the work when the brief ends, but I suspect there may be more than I can fit into a single post, so I wanted to point at some of the work that has emerged so far.

All the work here is from Alex Jarvis and Mark Williams.

Alex began by looking at the physical act of swiping your phone or card over a reader. The symbol he developed was based on his observations of people slapping their Oyster wallets down as they pass through the gates on to the underground. Not a delicate, patient hover over the yellow disc, but a casual thud, expectant wait for the barrier to open, then a lurching acceleration through to the other side before the gates violently spasm shut.

RFID physical act 01

More developed sketches here…

RFID physical act 02

I suspect that this inverted tick will abstract really well, I like the thin line on the more developed version snapping the path of the card into 3D. It succeeds since it doesn’t worry too much about working as an instruction and concentrates more on a powerful cross-system icon to be consistently recognisable.

Verbs

The original brief required students to develop icons for the verbs: purchase, identify, enter (but one way), download, phone and destroy.

Purchase and destroy are the two of these verbs with the most far-reaching and less immediate consequences. The aspiration for this work is to make the interaction feel like a purchase, not a touch that triggers a purchase. This gives the interaction room to grow into the more complex ones that will be needed in the future.

This first sketch, on purchase, from Alex shows your stack of coins depleting, something nice about the dark black arrow which repeats as a feature throughout Alex’s developments.

RFID Purchase 01

Mark has also been tackling purchase, his sketches tap into the currency symbols, again with a view to represent depletion. Such a blunt representation is attractive, it shouts “this will erode your currency!”

RFID Purchase 03

Mark explores some more on purchase here:

RFID Purchase 02

Purchase is really important. I can’t think of a system other than Oyster that takes your money so ambiguously. Most purchasing systems require you to enter pin numbers, sign things, swipe cards etc, all really clear unambiguous acts. All you have to do is wave at an Oyster reader and it costs you £2… maybe: The same act will open the barrier for free if you have a travel card on there. Granted, passengers have already made a purchase to put the money on the card, but if Transport for London do want to extend their system for use as a digital wallet they will need to tackle this ambiguity.

Both Mark and Alex produced material looking at the symbols to represent destroy, for instances where swiping the reader would obliterate data on it, or render it useless. This might also serve as a warning for areas where RFID tags were prone to damage.

RFID Destroy 01

I like the pencil drawing to the top right that he didn’t take forward. I’ve adjusted the contrast over it to draw out some more detail. Important that he distinguished between representing the destruction of the object and the data or contents.

Williams Destroy sketches

Mark’s sketches for destroy include the excellent mushroom cloud, but he also looks at an abstraction of data disassembly, almost looks like the individual bits of data are floating off into oblivion. Not completely successful since it also reminds me of broadcasting Wonka bars in Charlie and the Chocolate Factory and teleporting in Star Trek, but nice none the less.

Drawing

This is difficult to show online, but Alex works with a real pen, at scale. He is seeing the material he’s developing at the same size it will be read at. Each mark he makes he is seeing and responding to as he makes it.

Jarvis Pen

He has produced some material with Illustrator, but it lacked any of the impact his drawings brought to the icons. Drawing with a pen really helps avoid the Adobe poisoning that comes from Illustrator defaults and the complexities of working out of scale with the zoom tool (you can almost smell the 1pt line widths and the 4.2333 mm radius on the corners of the rounded rectangle tool). It forces him to choose every line and width and understand the success and failures that come with those choices. Illustrator does so much for you it barely leaves you with any unique agency at all.

It is interesting to compare the students’ two approaches. Alex works bluntly with bold weighty lines and stubby arrows portraying actual things moving or downloading. Mark tends towards more sophisticated representations and abstractions, and mini comic strips in a single icon. Lightness of touch and branching paths of exploration are his preference.

More to come from both students and I’ll also post some of my own efforts in this area.

Burtin vs. Ellis/Williams

I presented this comparison at Design Engaged last year. I like it because it talks in a really visceral way about how we read visual material. It deals with looking as an act as opposed to something that just happens to your eye. Comics are often disregarded amongst Graphic Design communities. This irritates me since comics deal with such rich and sophisticated material.

Below are two pieces of work, the first is a spread from Desolation Jones by Warren Ellis and J.H. Willliams III. Without revealing too much of my Ellis/Williams fanboydom, the series is excellent but this page is especially deft. Ellis discusses it in his weblog here.

Look at the way the red line connects the sequence.

The line morphs between road markings, Indiana Jones style aerial map views and back to the light trails from the vehicle. Williams guides your eye through the page, setting the page’s pace and rhythm. Optically it is very clever, it deals with how your eye scans at speed and also stitches the cue into the content of the panels.

Desolation Jones

The second image is by Will Burtin (thanks to James King). It is optically similar to the comic.

Although research material on Burtin is fairly thin, I understand that this image was produced during his time designing for the U.S. Army. This image is taken from a manual, illustrating how to disassemble your rifle.

Burtin has drawn two sets of dotted lines over his work. The lines indicate his expectation of how a readers eye will move over the page. The dotted line represents a quick scan of the page, dealing mostly with just the images and the dashed line represents a detailed read.

Will Burtin

Burtin knows how the page is being read, he acknowledges that the reader will read it at different paces, and presumably this has affected his slightly strange layout. Interesting that he expects people to read along gun barrels.

Burtin and Williams both use letters and images, in a sequence, on the page, and expect them to be read in two different ways: First in overview and then in detail. They deal with arrangement, pace and rhythm with the same sensitivity and same language.

Comics are in everything.

Lines and buttons

History of the Button is a blog, well, “Tracing the history of interaction design through the history of the button, from flashlights to websites and beyond.” [via Chris Heathcote’s links]

It’s great to look at early designs, when buttons were still brand new, and folks were still coming to terms with an action that could trigger an arbitrary amount of work. We think of a button press as the work itself, launching the missile or punching the letter, whatever, not simply completing the circuit that joins the actual cause (mechanical or electrical energy) to the effect. The button has become a by-word for easy. The 1960s sci-fi books I’ve read, when they want to express the maximum amount of crazy future thinking, talk about relays: devices that convert a button press to an action in a circuit that can do anything at all. Yet we barely think about relays now, or how incredible buttons are. When did buttons stop being modern?

(And, really, were they ever modern? A button on a shirt joins two pieces of cloth with effort far less than sewing, and it can be undone, and the physical object provides a focus for interaction too, the affordance that these things can be joined. Perhaps the name and job of “button” gets continually recycled, with only the physical implementation changing over the years.)

On a similar note:

I really enjoy collections of single design elements. Timo Arnall has written The dashed line in use, making the (dashed line) connection between his use of this element in indicating RFID interactions and how it occurs in instruction manuals, paths, graphs, as ellipsis… He also talks about how the line indicates a seam, a visible join between two things that still maintains the two things as separate.

The dashed line for RFID is doubly appropriate first because the field is invisible and, second, because the indicated interaction hasn’t happened yet–it exists only in potential.

Is there a dashed line to be drawn between Timo’s work and the history of the button?

Recent Posts

Popular Tags