Movement
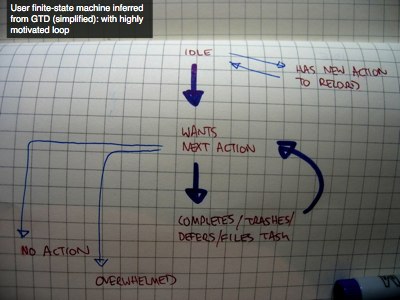
[The caption there says: User finite-state machine inferred from GTD (simplified).]
I know I promised I wouldn’t show any more flowcharts, but here’s just one more.
I was talking earlier about how Getting Things Done is really not one, but two finite-state machines, or Otto four-cycle engines, whichever metaphor you prefer.
There was a chart earlier which showed what states a task goes through in Getting Things Done.
This is a flowchart I’ve drawn that shows the states a user goes through when applying Getting Things Done. I said that a user is basically a machine running through a number of states. Well, here it is. A user’s main state is “idle.” Sometimes they find a new task to add to the list, so they do that and return to idle.
The important part is the loop drawn in bold: finding a new action, then doing it, then returning to find a new action, and doing it, and so on.
This is the loop that people get into Getting Things Done for: it’s the loop that provides the output power.
It’s therefore the loop that has to be designed to be the most highly motivated. The kind of questions to have to ask are: why does a user exit the idle state and look for a new task? Are they bored? Do they have to be encouraged or nagged?
Then to actually do the task: what rewards are there? Is there a reward fatigue we have to look out for? You see, by querying the motivations at every single transition, we find the parts of the overall experience we have to design for.
